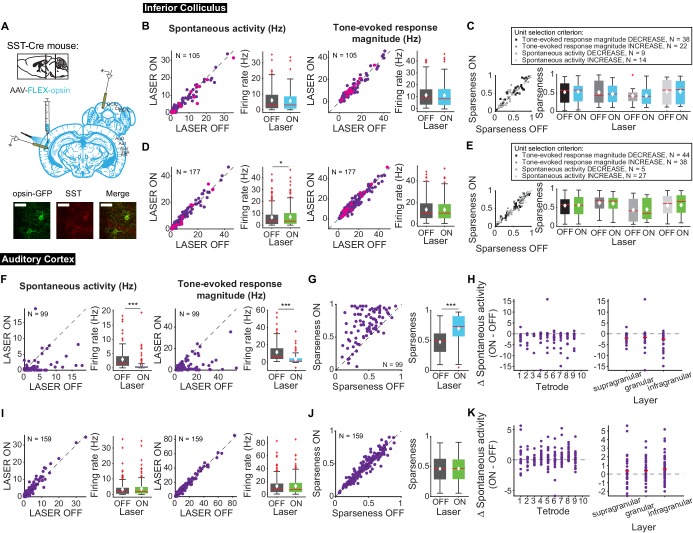
Figure 9. Effects of modulating SST interneurons in AC on tone-evoked responses in IC and AC.
On box plots, red line indicates median, white ◆ indicates mean. (A) Stain for SST (center) and opsin-GFP (left). Scale bar: 50 um. (B) Activating SSTs had no effect on spontaneous activity or tone-evoked response magnitude in IC. Magenta circles indicate single units. (C) Activating SSTs had no effect on frequency selectivity in IC. (D) Suppressing SSTs increased spontaneous activity (p=0.029, ON = 6.9 ± 0.66 Hz, OFF = 6.7 ± 0.63 Hz) but did not affect tone-evoked response magnitude in IC. Magenta circles indicate single units. (E) Suppressing SSTs had no effect on frequency selectivity in IC. (F) Activating SSTs decreased spontaneous activity (p=1.4e-12, ON = 0.97 ± 0.25 Hz, OFF = 2.9 ± 0.37 Hz) and tone-evoked response magnitude (p=1.3e-15, ON = 3.3 ± 0.59 Hz, OFF = 11.4 ± 1.2 Hz) in AC. (G) Activating SSTs increased frequency selectivity in putative excitatory units in AC (p=1.6e-13, ON = 0.69 ± 0.024, OFF = 0.47 ± 0.019). (H) Activating SSTs affected putative excitatory units across all layers of AC. (I) Suppressing SSTs increased spontaneous activity (p=8.1e-4, ON = 3.6 ± 0.41 Hz, OFF = 2.2 ± 0.38 Hz) but did not affect tone-evoked response magnitude in AC. (J) Suppressing SSTs had no effect on frequency selectivity in AC. (K) Suppressing SSTs affected putative excitatory units across all layers of AC. B,D,F,I Left panels: neuronal activity (spontaneous, left or tone-evoked, right) on laser on versus laser off trials. Right panels: Average neuronal activity (spontaneous, left or tone-evoked, right) for laser on and laser off trials. C,E,G,J Left panels: Sparseness for laser on versus laser off trials. Right panels: Average sparseness for laser on and laser off trials. (H,K) Change in spontaneous activity (laser on trials – laser off trials), left panels: for units at each tetrode; right panels: separated into supragranular: tetrodes 1–3; granular: tetrodes 5,6; infragranular: tetrodes 7–10.

