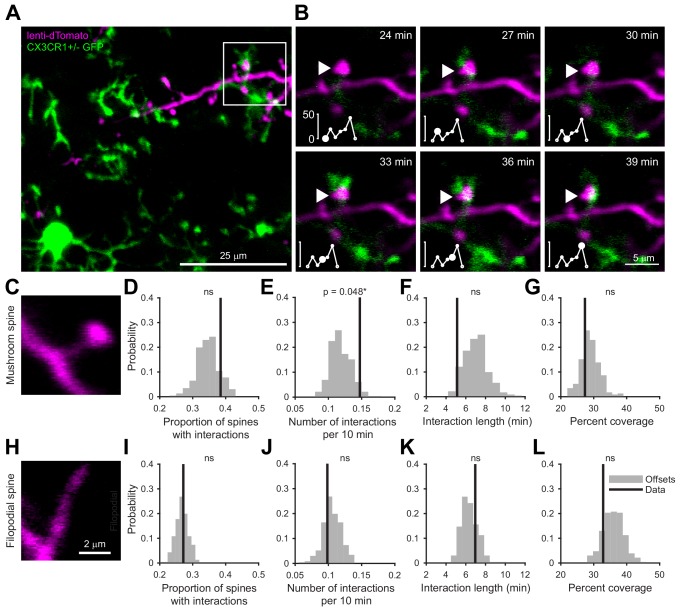
Figure 1. Microglia preferentially interact with mushroom spines on developing abGCs.
(A) Maximum intensity projection (10 µm volume at the first imaging timepoint) showing dTomato-labeled abGCs in a CX3CR1-GFP heterozygous mouse imaged 4 weeks after lentivirus injection. Brightness and contrast adjusted for display only. (B) Single plane time series showing the region marked in (A). Inset shows the calculated percent microglial coverage for the spine marked with the arrowhead (images shown for six frames, 7th frame not shown but the value is plotted, showing the end of the interaction) with the larger circle marking the value for the corresponding frame. Brightness and contrast adjusted with the same parameters for each timepoint for display only. (C) Single plane image showing an example of a spine classified as a mushroom spine because the spine head is wider and brighter than the spine neck. (D) Probability distribution showing the proportion of mushroom spines with at least one microglial interaction for mushroom spines in the real data (black line, ‘Data’) compared to values calculated from iteratively translating the microglial channel relative to the dendritic imaging channel (gray histogram, ‘Offsets’). The proportion of spines with interactions was not significantly higher than chance (one-tailed permutation test, p=0.13). (E) Probability distribution showing the number of interactions (normalized to 10 min) for mushroom spines. The mean number of interactions (value for each dendrite is the mean number across all mushroom spines on that dendrite) in the real data was significantly higher than chance (one-tailed permutation test, p=0.048). (F) Probability distribution showing interaction length for mushroom spines (for spines that had at least one frame that met the criteria for an interaction, see Materials and methods). The mean interaction length across all dendrites (value for each dendrite is the mean interaction length across all interactions for all mushroom spines) was not higher than chance (one-tailed permutation test, p=0.96). (G) Probability distribution showing maximum percent coverage (mean across all interactions for a given spine for spines that had at least one frame that met the criteria for an interaction). The mean maximum percent coverage across all dendrites (value for each dendrite is the mean interaction length across all interactions for all mushroom spines) was not higher in the real data (one-tailed permutation test, p=0.72). (H) Single plane image of a spine classified as a filopodial spine because it has no clear spine head. (I) Probability distribution showing the proportion of spines with at least one microglial interaction for filopodial spines. The proportion of filopodial spines with interactions was not significantly higher than chance (one-tailed permutation test, p=0.39). (J) Probability distribution showing the number of interactions (normalized to 10 min) for filopodial spines. The mean number of interactions (value for each dendrite is the mean number across all filopodial spines on that dendrite) in the real data was not significantly higher than chance (one-tailed permutation test, p=0.72). (K) Probability distribution showing interaction length for filopodial spines (for spines that had at least one frame that met the criteria for an interaction, see Materials and methods). The mean interaction length across all dendrites (value for each dendrite is the mean interaction length across all interactions for all filopodial spines) was not significantly higher than chance (one-tailed permutation test, p=0.23). (L) Probability distribution showing maximum percent coverage (mean across all interactions for a given spine for spines that had at least one frame that met the criteria for an interaction). The mean maximum percent coverage across all dendrites (value for each dendrite is the mean interaction length across all interactions for all filopodial spines) was not higher in the real data (one-tailed permutation test, p=0.84). n = 726 spines (271 mushroom spines and 455 filopodial spines) from 48 dendrites combined at 1, 2, 3, and 4 weeks post injection in three mice. ns, not significant; *p<0.05.

