. 2020 Mar 9;9:e50531. doi: 10.7554/eLife.50531

Figure 2. Microglial depletion during development reduces odor-evoked responses of abGCs in anesthetized mice.

(A) Experimental timeline for microglial depletion during development of abGCs. A cranial window was implanted and 3 weeks later mice were given control or PLX5622-containing chow for the remainder of the experiment. After 3 weeks of chow consumption, a lentivirus was injected into the RMS to label abGCs, which were imaged 5–6 weeks later. (B) Left, images of Iba1 staining in the olfactory bulb of control (top) and PLX-treated (bottom) mice. White squares show the locations of the enlarged insets. Dotted lines mark the upper edge of the glomerular and granule cell layers. Right, schematic showing injection of a lentivirus encoding dTomato and GCaMP6s and microglial depletion. (C) Example fields of view showing an average intensity projection of dTomato structural images of abGC dendrites (left) and overlaid heatmaps of GCaMP6s-recorded activity (right) in response to ethyl valerate in control (top) and PLX5622-treated (bottom) mice. (D) GCaMP6s traces showing odor responses of example ROIs from control (top) and PLX-treated (bottom) mice (chosen to have the same ranked response to the first odor). Gray traces represent responses on individual trials and colored trace is the mean across trials. Individual trial traces were median filtered over three frames before averaging for presentation. *, odor responses for which the mean response was above threshold (E) Heatmap traces from the 100 ROIs with the largest odor-evoked Ca2+ signals across all mice ranked separately for each of 15 odors (molecular structures shown above). Black bar denotes odor time. Bottom, mean response time course for each odor across all ROIs. (F) Cumulative distribution showing that the distribution of responses (averaged across odors for each dendrite) is shifted to the left in PLX-treated mice (Two sample Kolmogorov–Smirnov test for probability distributions, D = 0.25, p=2.56e-08) while the noise distributions constructed from blank trials are not different (D = 0.042, p=0.96). (G) Cumulative distribution showing the number of effective odors (odors that evoked responses above the ROC threshold 0.39, which was calculated across all dendrites from both groups). The median number of effective odors was significantly lower in the PLX-treated group (Wilcoxon rank sum test, z = 3.86, p=1.15e-04). (H) Raincloud plot showing the distribution of lifetime sparseness across all dendrites. Above, kernel density estimate. Below, boxplot showing the median, interquartile range (box), and 1.5 times the interquartile range (whiskers) superimposed on a dot plot of all the data (one dot per dendrite). Median lifetime sparseness was significantly lower in the PLX-treated group (Wilcoxon rank sum test, z = 3.53, p=4.18e-04). n = 287 dendrites from five control mice and 277 dendrites from 7 PLX-treated mice. *p<0.05, **p<0.01, ***p<0.001.

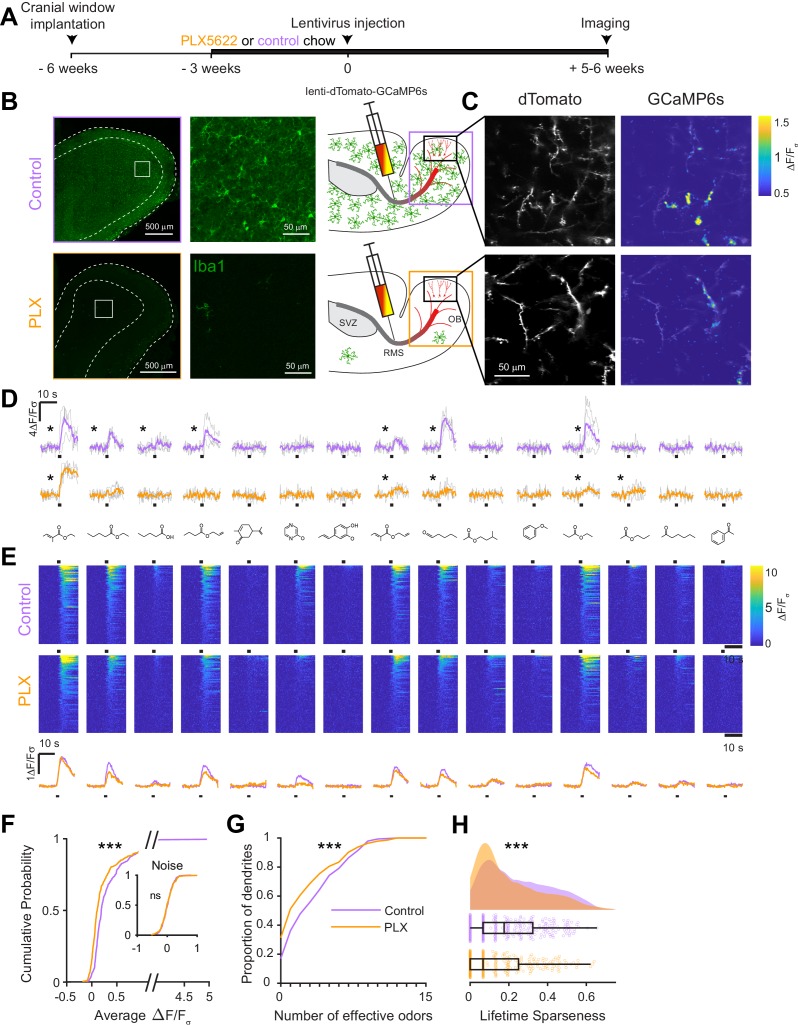
Figure 2—source data 1. This spreadsheet contains values from each dendrite from each mouse for Figure 2F,G and H.

Figure 2.

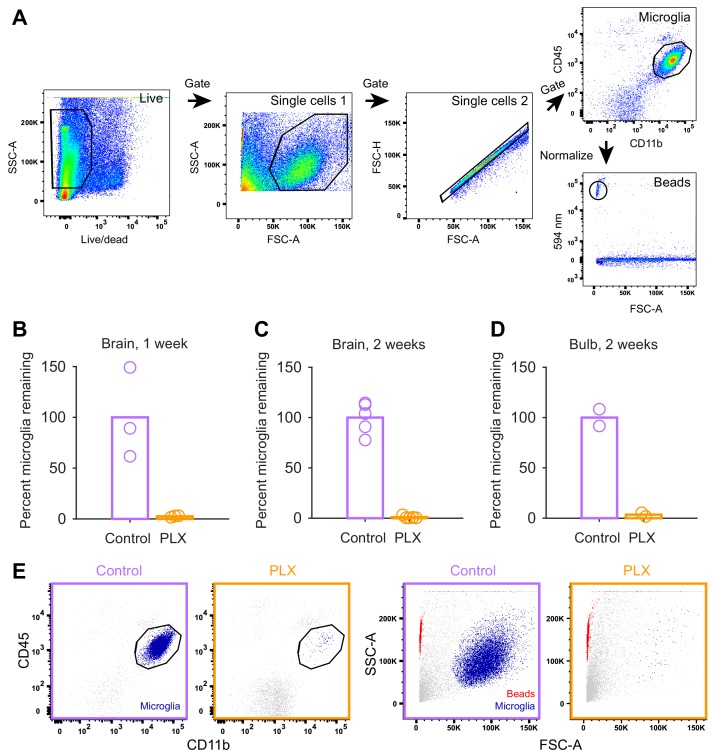
Figure 2—figure supplement 1. Quantification of microglial depletion with flow cytometry.

Figure 2—figure supplement 1.

(A) Microglial cells were gated on CD45intermediate and CD11bhigh using the following gating strategy: Debris and dead cells were excluded based on the fluorescent intensity of a dead cell stain. Next, single cells where determined based on of their light scattering properties (first by side over forward scatter, SSC-A/FSC-A, and second by forward scatter height over area, FSC-H/FSC-A). The counting beads were identified based on their fluorescent emission at 594 nm. (B) Plot showing the percent of live microglia remaining (normalized to the mean of the controls) in mice treated with PLX compared to controls (number of microglia in each sample normalized to counting beads) in whole brain samples after 1 week of control or PLX diet demonstrating 97.4% ablation. (C) Plot showing the percent of live microglia remaining in mice treated with PLX (normalized to the mean of the controls) compared to controls (number of microglia in each sample normalized to counting beads) in whole brain samples after 1 week of control or PLX diet, demonstrating 99.0% ablation. (D) Plot showing the percent of live microglia remaining in mice treated with PLX (normalized to the mean of the controls) compared to controls measured via flow cytometry in olfactory bulb samples after 2 weeks of control or PLX diet, demonstrating 96.4% ablation. (E) Interrogation of light scattering properties (SSC-A/FSC-A) independent of surface marker labeling revealed that hardly any cells remained in the microglia enriched samples after treatment with PLX compared to control samples. This becomes visually more apparent when microglia cells (CD45intermediate, CD11bhigh, control and PLX-treated plots on left) are backgated to SSC-A/FSC-A plots on right (in dark blue). Note that counting beads can be observed in red. Bars represent the mean across mice (circles). Whole brain: n = 5 control and 5 PLX mice. OB: n = 2 control and 2 PLX samples (each sample contained both OBs from two littermates which were combined after dissection).
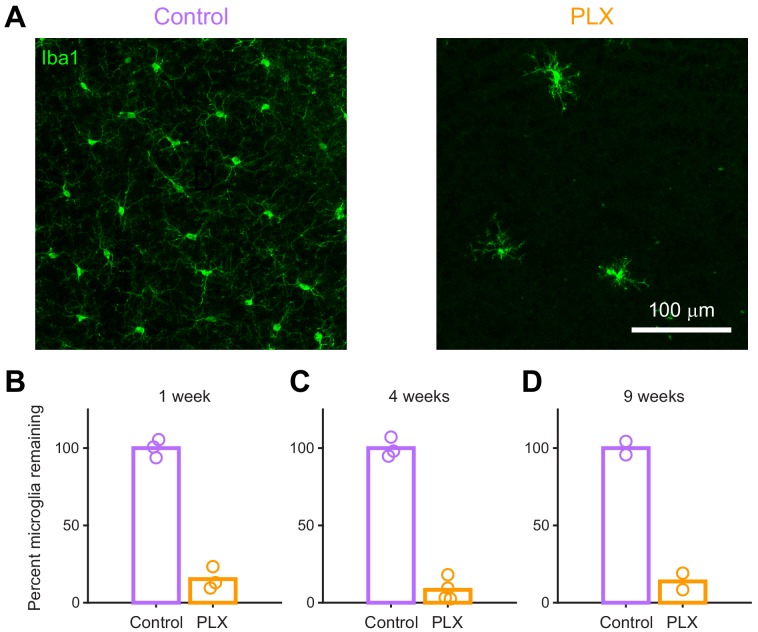
Figure 2—figure supplement 2. Quantification of microglial depletion with immunohistochemistry.

Figure 2—figure supplement 2.

(A) Maximum intensity projection showing microglia stained with anti-Iba1 in the granule cell layer of the olfactory bulb in control (left) and PLX-treated (right) mice after 4 weeks of treatment. (B) Plot showing the percent of microglia remaining in mice treated with PLX compared to control littermates based on counting of cell bodies stained with Iba1 after 1 week of treatment, demonstrating 84.7% ablation. (C) Percent microglia remaining after 4 weeks of treatment (same mice used for spine quantification in Figure 5), demonstrating 91.7% ablation. (D) Percent microglia remaining after 9 weeks of treatment (PLX mice are the same mice used for imaging at the 9 weeks timepoint in Figure 4—figure supplement 1 and control mice are age-matched controls), demonstrating 86.2% ablation. Bars represent the mean across mice (circles). n = 3 mice (1 week), four mice (4 weeks), and two mice (9 weeks).
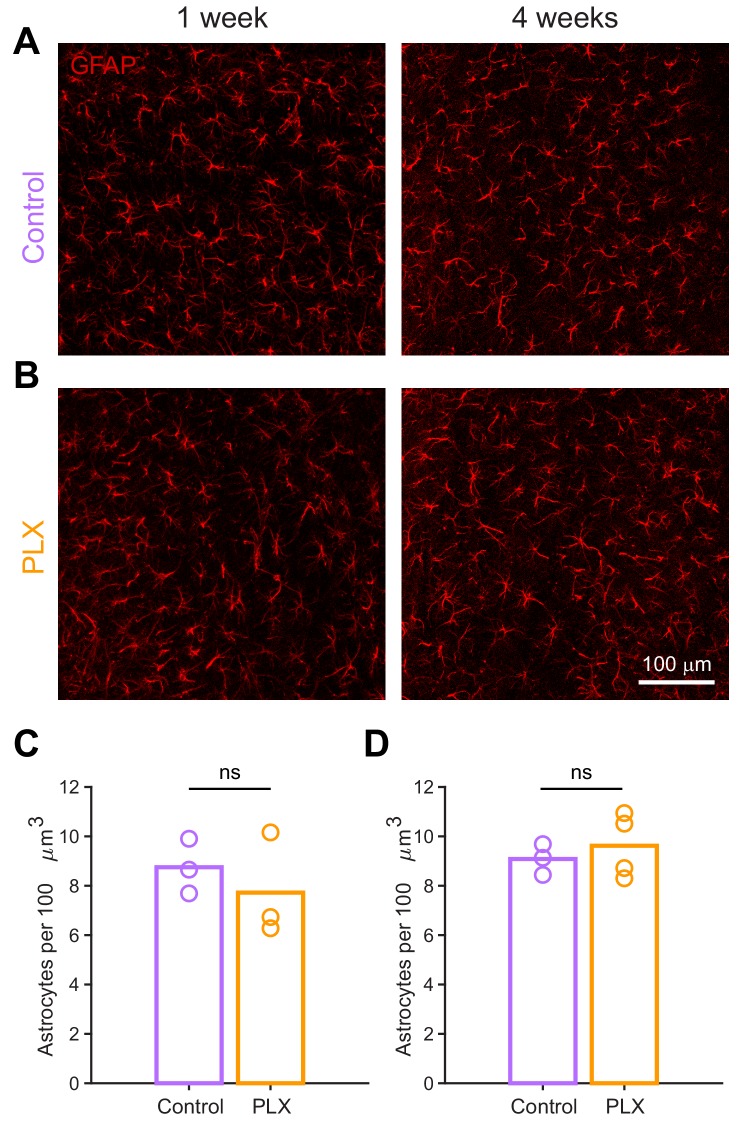
Figure 2—figure supplement 3. Astrocytic response to microglial depletion.

Figure 2—figure supplement 3.

(A) Maximum intensity projection showing astrocytes stained with anti-GFAP in the granule cell layer of the olfactory bulb in control mice 1 week (left) and 4 weeks (right) after beginning treatment. (B) Maximum intensity projection showing astrocytes stained with anti-GFAP in the granule cell layer of the olfactory bulb in PLX-treated mice 1 week (left) and 4 weeks (right) after beginning treatment. (C) Plot showing the number of astrocytes counted in control versus PLX-treated mice 1 week after the start of treatment. The median numbers were not significantly different between groups (Wilcoxon rank sum test, rank sum = 12, p=0.70). (D) Plot showing the number of astrocytes counted in control versus PLX-treated mice 4 weeks after the start of treatment. The median numbers were not significantly different between groups (Wilcoxon rank sum test, rank sum = 11, p=0.86). Bars represent the median across mice (circles). n = 3 control versus 3 PLX-treated mice (1 week) and 3 control versus 4 PLX-treated mice (4 weeks). ns, not significant.
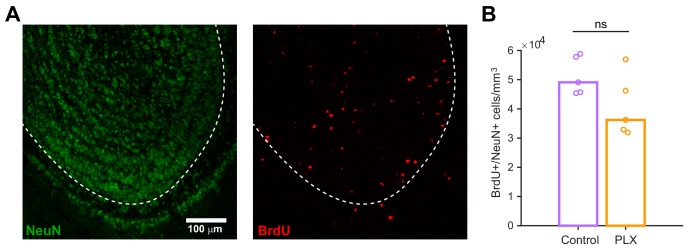
Figure 2—figure supplement 4. Microglial depletion does not affect the number of maturing abGCs.

Figure 2—figure supplement 4.

(A) Maximum intensity projection showing NeuN staining (left) and BrdU staining (right) in the olfactory bulb. Dotted line indicates boundary of the granule cell layer, where positive cells were quantified. (B) Plot showing the density of BrdU+/NeuN+ cells per mm3 in the granule cell layer of the olfactory bulb in control mice and mice treated with PLX for 4 weeks, beginning 3 days after BrdU injection. The density was not different between groups (Wilcoxon rank sum test, rank sum = 35, p=0.15). Bars represent the median across mice (circles). n = 5 control and 5 PLX-treated mice. ns, not significant.
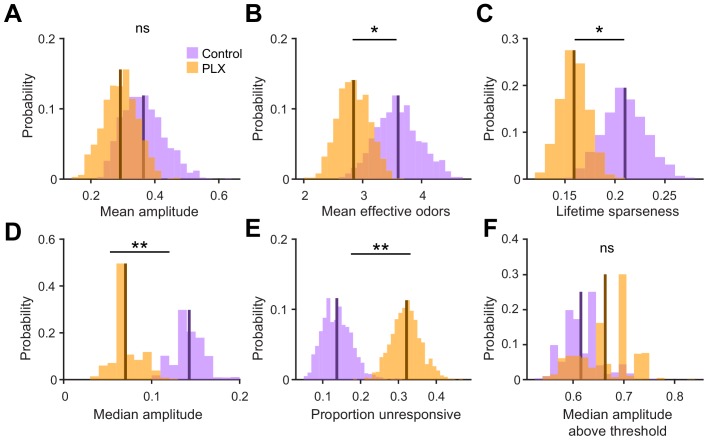
Figure 2—figure supplement 5. Further analysis of odor responses in abGCs in control versus PLX-treated mice.

Figure 2—figure supplement 5.

(A) Sampling distributions of the mean response amplitude obtained with the hierarchical bootstrap. The mean amplitude (estimated by the mean of the sampling distribution, dark line) were not significantly different between dendrites in control versus PLX-treated mice (hierarchical bootstrap, p=0.21). (B) Sampling distributions of the mean number of effective odors (of the 15-odor panel) evoking a significant response. The mean number of effective odors was significantly greater in control than PLX-treated mice (hierarchical bootstrap, p=0.050). (C) Sampling distributions of the mean lifetime sparseness. The mean lifetime sparseness was significantly greater in control than PLX-treated mice (hierarchical bootstrap, p=0.023). (D) Sampling distributions of the median response amplitude. The median amplitude was significantly higher in control than PLX-treated mice (hierarchical bootstrap, p=0.0011). (E) Sampling distributions of the proportion of dendrites that did not respond to any of the odors. The mean proportion of unresponsive dendrites was significantly greater in PLX-treated mice (hierarchical bootstrap, p=0.0013). (F) Sampling distributions of the median response amplitude, only considering responses that were above the threshold. The median response amplitude above threshold was not different between groups (hierarchical bootstrap, p=0.77). The means of the sampling distributions are shown as dark lines and were used to estimate the value of the parameter (x-axis label) for each group. n = 287 dendrites from 5 control mice and 277 dendrites from 7 PLX-treated mice. ns, not significant; *p<0.05, **p<0.01.