
Figure 5. Microglial depletion during development reduces spine head volume in abGCs.
(A) Experimental timeline for microglial depletion during development of abGCs. Mice were given control or PLX5622-containing chow on the same day that a lentivirus was injected into the RMS to label abGCs. Spine numbers and morphology were quantified 4 weeks later. (B) Above, sample images showing two apical dendrites from one cell that were analyzed in a control mouse (left) and PLX-treated mouse (right). Below, insets from the images shown above, showing spine morphology in more detail. (C) Spine density averaged across 1–5 apical dendrites from each abGC. Spine density was higher in PLX-treated mice (Wilcoxon rank sum test, z = −2.07, p=0.039). Bars indicate medians across cells (circles). (D) Cumulative distribution showing the volume of all spines analyzed. Inset, sampling distributions of the mean head volume obtained with the hierarchical bootstrap. The mean head volume (dark lines) was greater in control versus PLX-treated mice (hierarchical bootstrap, p=0.057). n = 810 spines from 17 abGCs from three control mice and 1551 spines from 17 abGCs from 4 PLX mice. *p<0.05.
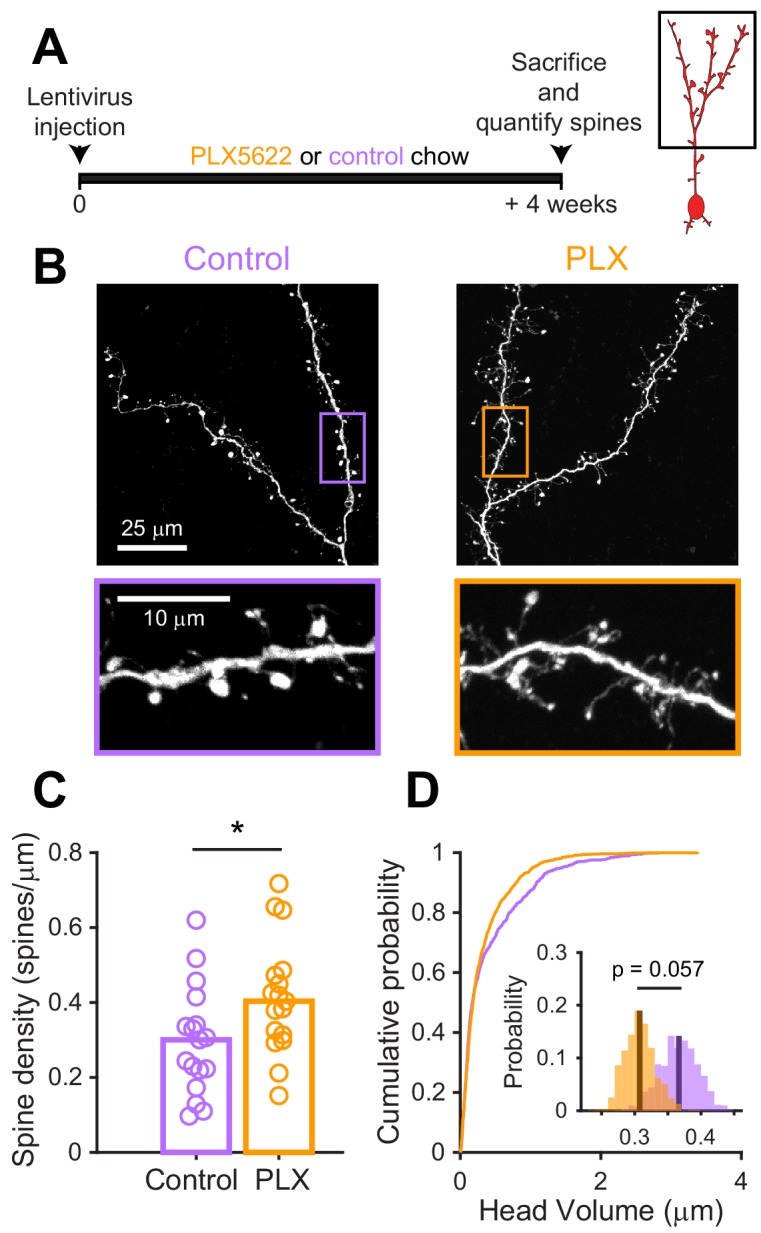
Figure 5—figure supplement 1. Further analysis of spine density and volume in control versus PLX-treated mice.
