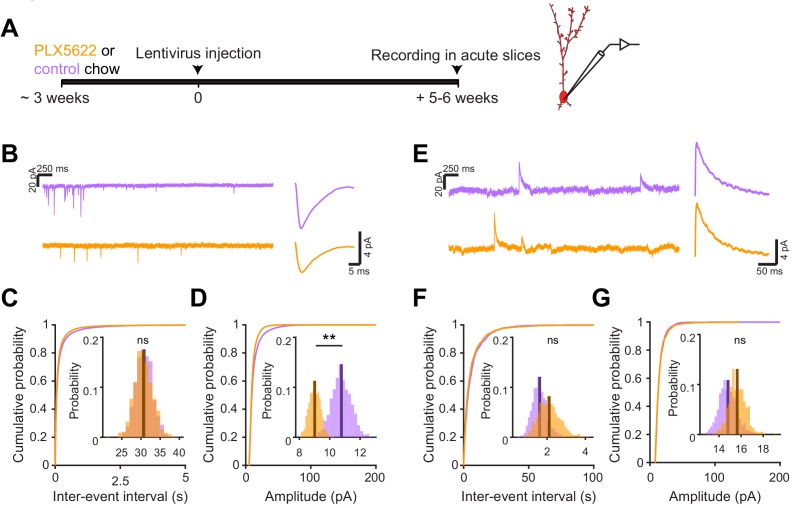
Figure 6. Microglial depletion during abGC development reduces the amplitude of excitatory synaptic currents but does not affect inhibitory synaptic currents.
(A) Experimental timeline for electrophysiological recording in abGCs (B) Left, sample sections from raw traces recorded from abGCs in control (top) and PLX-treated (bottom) mice. Right, median EPSCs across all EPSCs detected from all mice. (C) Cumulative distribution showing the inter-event intervals from all recorded EPSCs. Inset, sampling distributions of the mean frequency obtained with the hierarchical bootstrap. The median frequencies (dark lines) were not significantly different (hierarchical bootstrap, p=0.48). (D) Cumulative distribution showing the amplitudes from all recorded EPSCs. Inset, sampling distributions of the mean amplitude obtained with the hierarchical bootstrap. The mean amplitude (dark line) was significantly higher in control cells (hierarchical bootstrap, p=0.0068). (E) Left, Sample sections from raw traces recorded from abGCs in control (top) and PLX-treated (bottom) mice. Right, median IPSCs across all IPSCs detected from all mice. (F) Cumulative distribution showing the inter-event intervals from all recorded IPSCs. Inset, sampling distributions of the median frequency obtained with the hierarchical bootstrap. The mean frequencies (dark lines) were not significantly different (hierarchical bootstrap, p=0.77). (G) Cumulative distribution showing the amplitudes from all recorded IPSCs. Inset, sampling distributions of the mean amplitude obtained with the hierarchical bootstrap. The mean amplitudes (dark lines) were not significantly different (hierarchical bootstrap, p=0.79). For EPSCs: n = 30 abGCs from four control mice and 33 abGCs from 4 PLX mice. For IPSCs: n = 29 abGCs from four control mice and 30 abGCs from 4 PLX mice (same mice in both cases and cells used for both EPSCs and IPSCs if the recordings met criteria stated in Materials and methods). ns, not significant; **p<0.01.
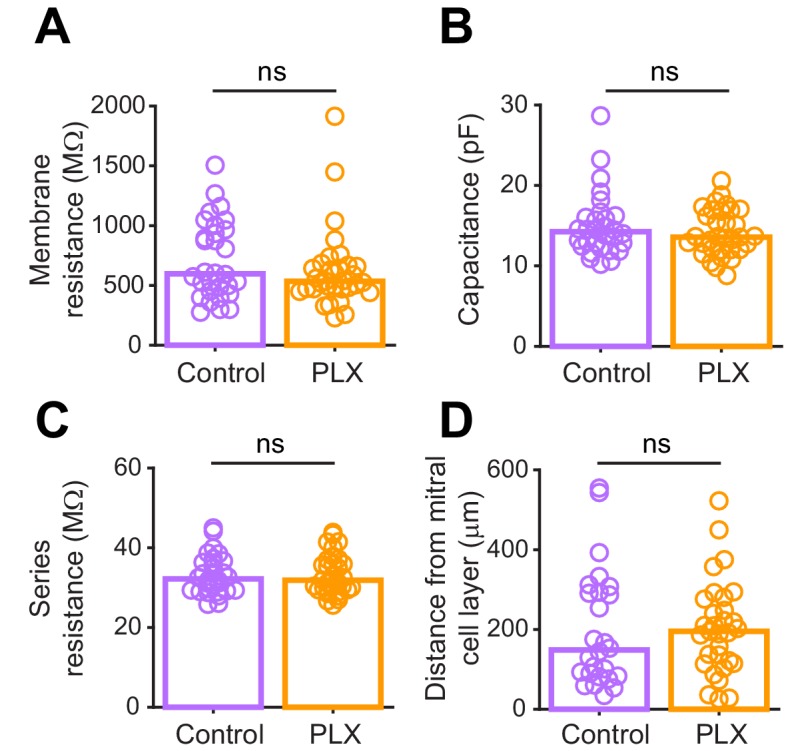
Figure 6—figure supplement 1. Passive electrophysiological properties and recording conditions are similar for abGCs in control versus PLX-treated mice.


