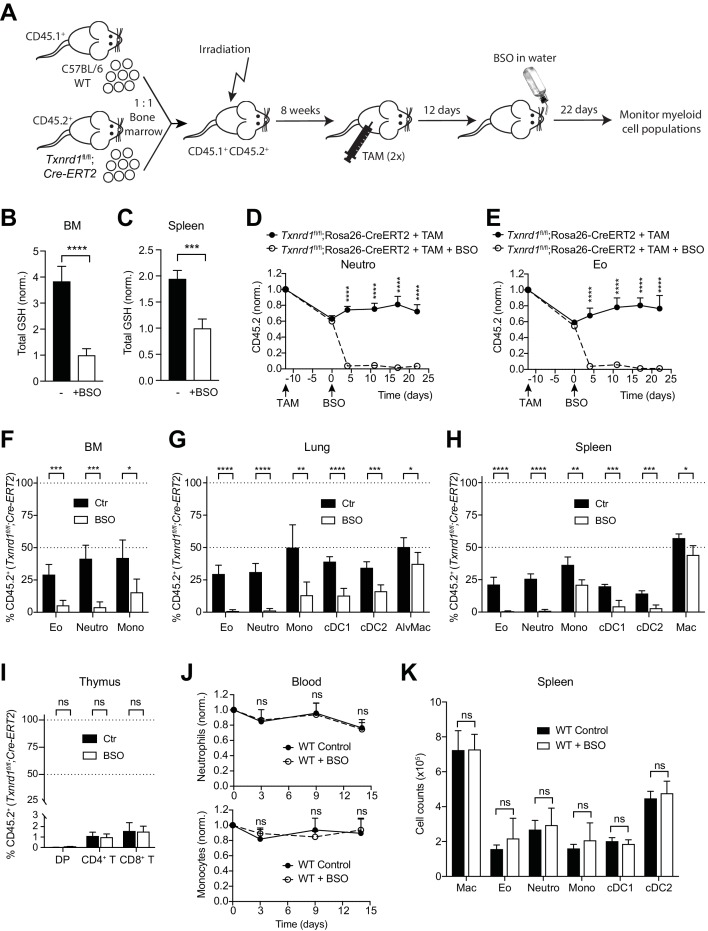
Figure 2. The GSH/Grx system sustains the development and maintenance of Txnrd1-deficient myeloid cells.
(A–I) Lethally irradiated WT mice (CD45.1+CD45.2+) were reconstituted with a 1:1 mixture of WT (CD45.1+) and Txnrd1fl/fl;Rosa26-CreERT2 (CD45.2+) bone marrows. After reconstitution, mice were injected with TAM to delete the Txnrd1 gene, and after 12 days BSO was administered in the drinking water to deplete GSH levels. Cell populations in the blood were monitored over time, and animals were analysed on day 22 upon BSO administration (n = 4–5 mice). (A) Schematic showing the experimental setup. (B, C) Depicted are the total glutathione (GSH) levels in the lysates from total bone marrow (BM) cells (B) and spleen (C). (D, E) The percentages of CD45.2+ neutrophils (D) and eosinophils (E) in the blood were monitored over the indicated period of time. (F–H) The percentages of the indicated myeloid-cell populations coming from the Txnrd1fl/fl;Rosa26-CreERT2 (CD45.2+CD45.1-) donors were analyzed in the bone marrow (BM; F), lungs (G) and spleen (H) on day 22 upon BSO administration. (I) The percentages of the indicated thymocyte populations coming from the Txnrd1fl/fl;Rosa26-CreERT2 (CD45.2+CD45.1-) donors were analyzed 22 days after BSO administration. (J, K) WT mice were treated with BSO in the drinking water and analyzed 2 weeks later (n = 4–5 mice). (J) Total neutrophils (above) and monocytes (below) in the blood were monitored over the period of 2 weeks. The percentages at the indicated times were normalized with the percentage on day 0. (K) Shown are the total numbers of the indicated myeloid-cell populations in the spleen 2 weeks after BSO administration. Neutro, neutrophils; Eo, eosinophils; Mono, monocytes; AlvMac, alveolar macrophages; cDC1/2, type 1/2 conventional dendritic cells; Mac, macrophages; DP, CD4+CD8+ double positive thymocytes; CD4+ T, CD4+ single positive thymocytes; CD8+ T, CD8+ single positive thymocytes. Bar graphs and dot plots show mean + standard deviation (B–K). Data are representative of two independent experiments. For each panel, a representative experiment with biological replicates (B–K) is shown. Student’s t test (two-tailed, unpaired) was used for the comparison of two groups (B, C, F–I, K): *, p≤0.05; **, p≤0.01; ***, p≤0.001; ****, p≤0.0001; ns, not significant. Two-way ANOVA adjusted by Bonferroni's multiple comparison test was used in D, E, J: ****, p≤0.0001; ns, not significant.
Figure 2—figure supplement 1. The GSH/Grx system compensates for the absence of the Trx1 pathway in Txnrd1-deficient monocytes.
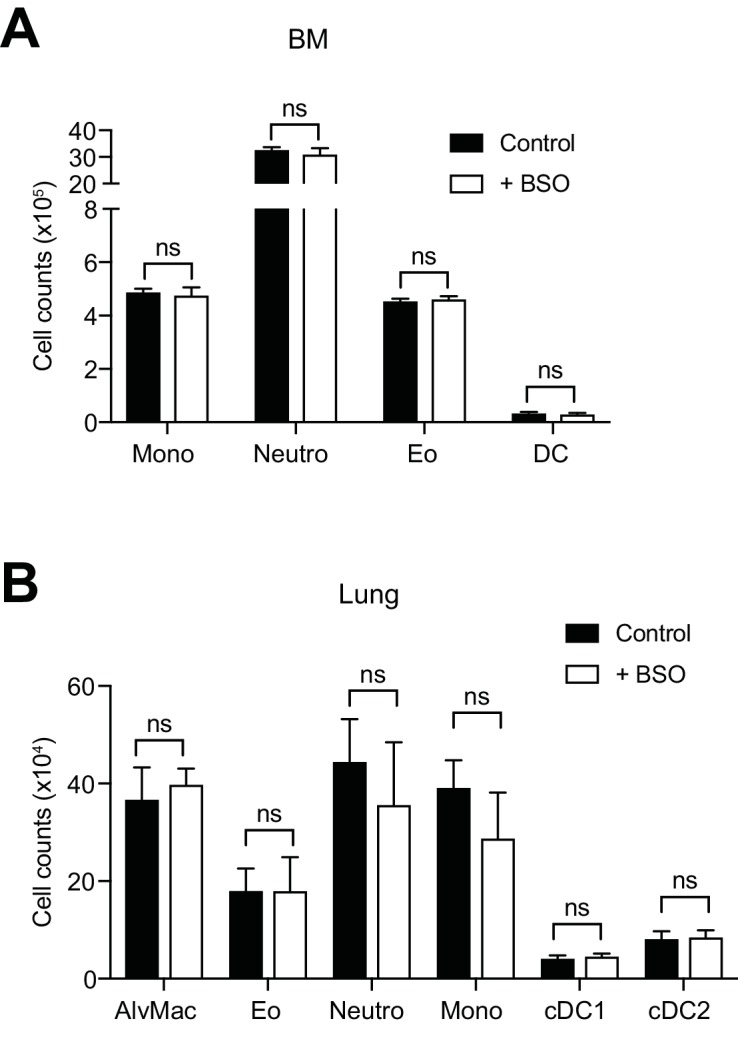
Figure 2—figure supplement 2. BSO administration does not affect the maintenance and homeostasis of WT myeloid cells.


