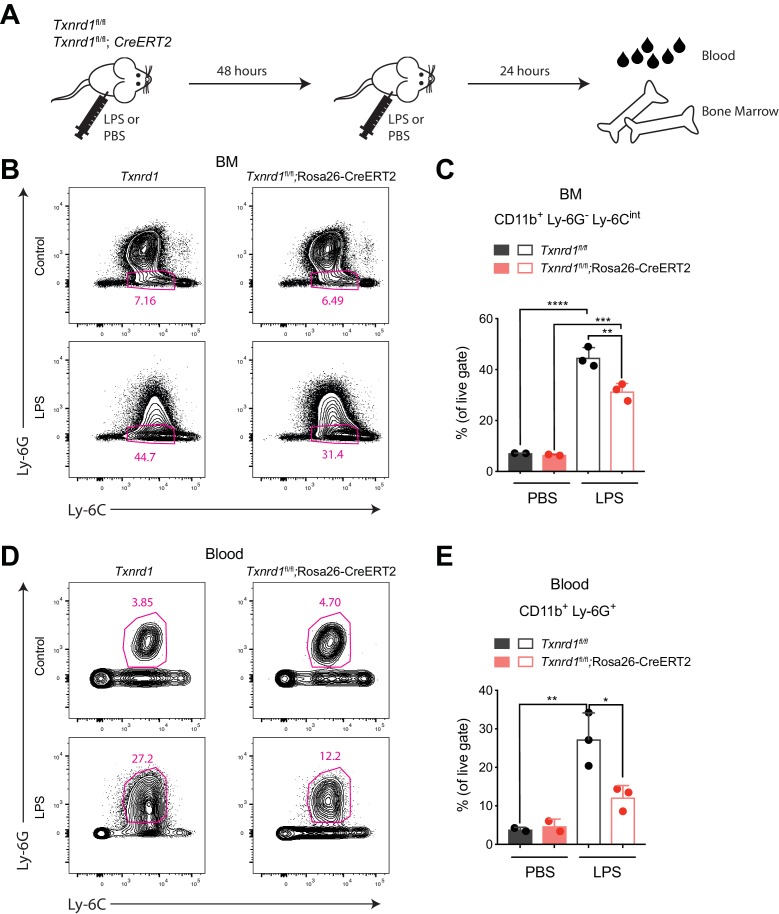
Figure 3. The Trx1 system is required in the bone marrow during emergency hematopoiesis.
(A–E) TAM-treated Txnrd1fl/fl;Rosa26-CreERT2 mice (or Txnrd1fl/fl littermate controls) were intraperitoneally injected with 35 μg LPS in a 48 hr interval and sacrificed 24 hr later for analysis (n = 3 mice). (A) Schematic showing the experimental setup. (B, C) Shown are the gating strategy (B) and percentages (C) of CD11b+Ly-6G-Ly-6Cint cells in the bone marrow (BM). (D, E) Depicted are the gating strategy (D) and percentages (E) of CD11b+Ly-6G+ neutrophils in the blood. Numbers in the FACS plots indicate the average percentages of the depicted gate. Bar graphs show mean + standard deviation (C, E). Data are representative of three independent experiments. For each panel, a representative experiment with biological replicates (B–E) is shown. One-way ANOVA adjusted by Tukey’s multiple comparison test was used in C, E: *p≤0.0332; **p≤0.0021; ***p≤0.0002; ****p≤0.0001.

