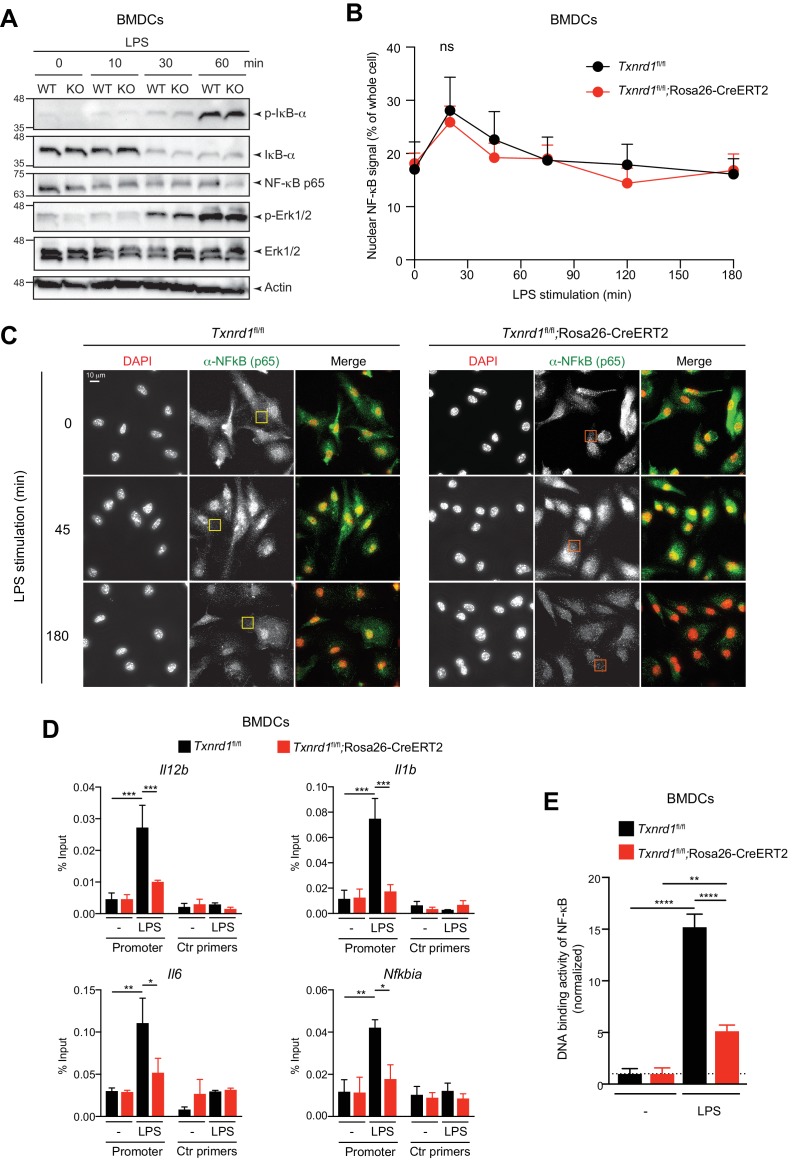
Figure 5. The Trx1 system positively regulates the binding activity of NF-κB p65 to the DNA in BMDCs.
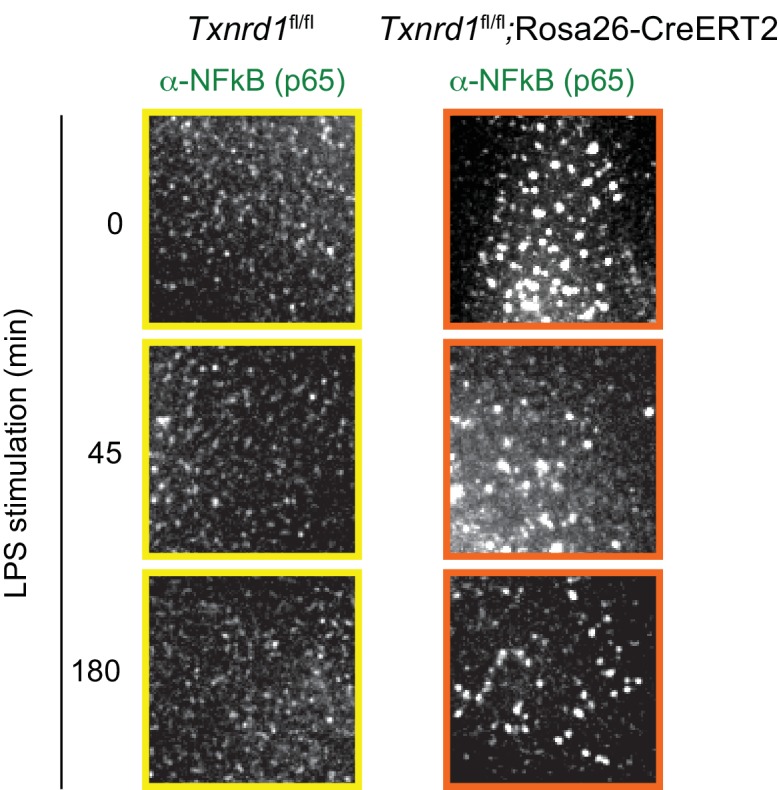
(A–E) Txnrd1fl/fl;Rosa26-CreERT2 mice and Txnrd1fl/fl littermates were injected with TAM to delete the Txnrd1 gene, and bone marrow cells were differentiated with GM-CSF to obtain BMDCs. (A) BMDCs were stimulated with LPS (400 ng/ml) for 10, 30, or 60 min and lysed for western blot. Expression of phospho-IκB-α, respective IκB-α, NF-κB p65, phospho-Erk1/2 and respective Erk1/2 was assessed with β-actin as a loading control. (B, C) WT or Txnrd1-deficient BMDCs were fixed at the indicated time points post LPS treatment, stained for DNA (DAPI), NF-κB p65 and actin (Phalloidin), and imaged using a DeltaVision system. Approximately 10 randomly chosen imaging fields encapturing a total of 50–100 nuclei were analyzed per sample per condition. (B) Nuclear and whole-cell masks were made using the DAPI and phalloidin channels, and NF-κB signal intensity within the masks was quantified. Shown is the nuclear NF-κB signal strength plotted as percentage of whole-cell NF-κB signal. (C) Depicted are example images of the samples of indicated times points post LPS treatment. In the merged images, DAPI and anti-NF-κB channels are shown in red and green, respectively. Scale bar represents 10 μm (top-left panel). Squares indicate fields, which are magnified in Figure 5—figure supplement 2. (D) WT or Txnrd1-deficient BMDCs were stimulated with LPS (400 ng/ml) for 100 min, and the recruitment of NF-κB p65 to the Il12b (top-left), Il1b (top-right), Il6 (bottom-left) and Nfkbia (bottom-right) promoters was assessed by p65 chromatin immunoprecipitation (ChIP) analysis and quantified by RT-PCR. ‘Promoter’ indicates the utilization of a primer pairs that amplify a fragment close to the NF-κB binding sites at the promoter region of the indicated genes, whereas ‘Ctr primers’ indicate primer pairs that were used as a control to amplify a region several kilobases away from the NF-κB binding sites (n = 2). (E) The NF-κB p65 binding activity to its DNA response element in nuclear extracts from BMDCs stimulated with LPS (400 ng/ml) for 40 min was assessed by an ELISA-based method (n = 3). Bar graphs and dot plots represent mean + standard deviation. Data are representative of two (A–D) or three (E) independent experiments. For each panel, a representative experiment with technical replicates is shown (D, E). Two-way ANOVA adjusted by Bonferroni's multiple comparison test was used in B: ns, not significant. One-way ANOVA adjusted by Tukey’s multiple comparison test was used in D, E: *p≤0.0332; **p≤0.0021; ***p≤0.0002; ****p≤0.0001.
Figure 5—figure supplement 1. Txnrd1 deficiency does not affect TLR signaling.

Figure 5—figure supplement 2. Magnification of the microscopy images of Figure 5C.


