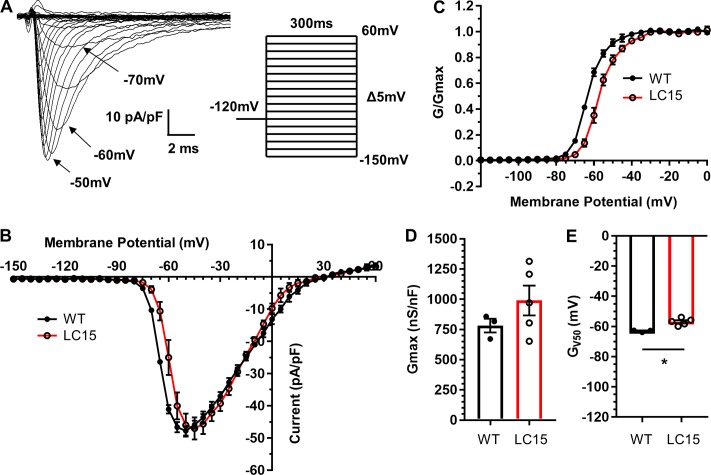
Figure 6.
Peak inward sodium current density is unaltered and the voltage dependence of activation is right-shifted in ventricular myocytes from LC15 mice. (A) Representative superimposed inward sodium current traces measured during 300-ms voltage steps from −150 mV to +60 mV in 5-mV increments. Steps were delivered at 5.5-s intervals to provide sufficient time for recovery from inactivation. (B) Average peak sodium current density versus voltage relationship for myocytes from WT (n = 3; closed circles) and LC15 (n = 5; open circles) mice. (C) Normalized conductance (G/Gmax) versus voltage relationships. (D and E) Maximum channel conductance (Gmax; D) and the membrane potential for half-maximal activation (E) in ventricular myocytes from WT (closed circles) and LC15 (open circles) mice. Error bars represent SEM. *, P < 0.05.

