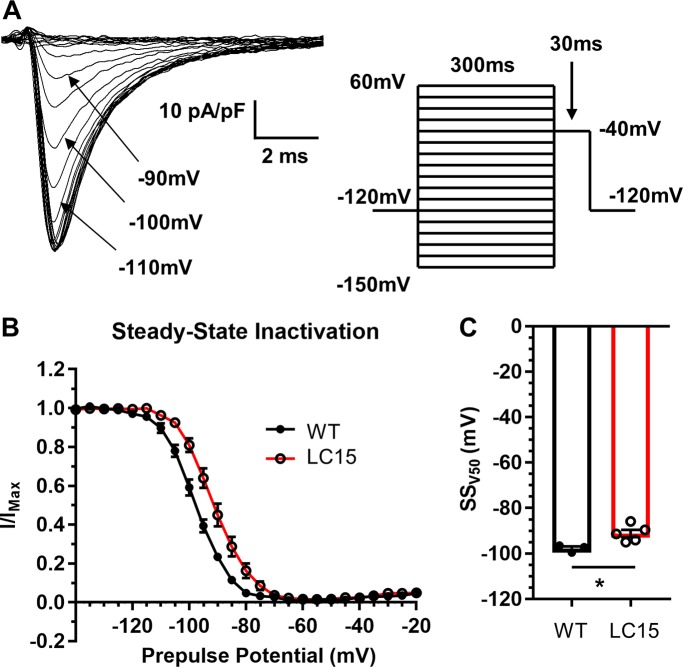
Figure 7.
Voltage dependence of steady-state sodium channel inactivation is right-shifted in ventricular myocytes from LC15 mice. (A) Representative inward sodium currents measured during 30-ms voltage steps to −40 mV (indicated by arrow) following 300-ms inactivating prepulses of varied amplitude in a ventricular myocyte from a WT mouse. Prepulses were sequentially increased by 5 mV, from −150 mV to +60 mV, and delivered at 5.5-s intervals in order to provide sufficient time for full recovery from inactivation. (B) Voltage dependence of steady-state inactivation of relative peak sodium current amplitude (I/Imax) in myocytes from WT (n = 3; closed circles) and LC15 (n = 5; open circles) mice. (C) Average voltage for half-maximal steady-state inactivation (SSV50) measured in myocytes from WT (closed circles) and LC15 (open circles) mice. Error bars represent SEM. *, P < 0.05.

