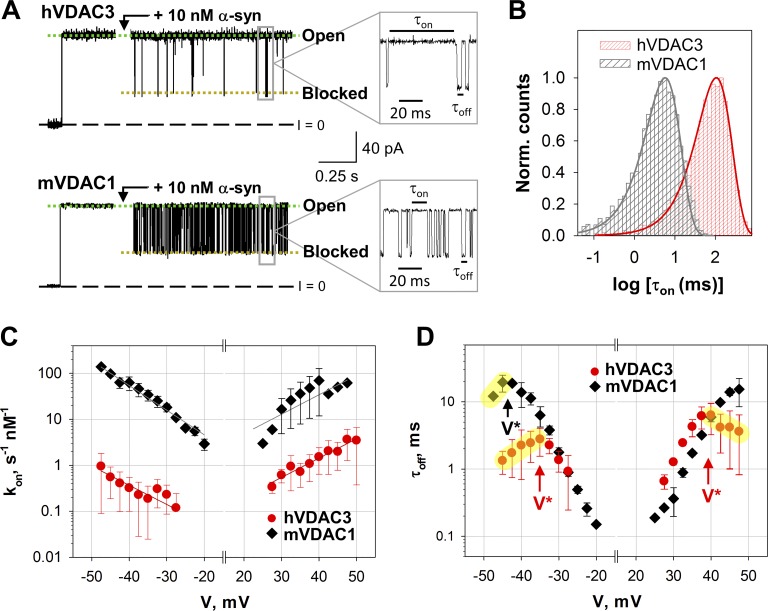
Figure 5.
α-Syn blocks hVDAC3 less efficiently than mVDAC1. (A) Representative hVDAC3 and mVDAC1 open single-channel current traces before and after the addition of 10 nM α-syn (at +30 mV of applied voltage). Insets show fragments of current records at a finer time scale. Current records were digitally filtered at 5 kHz using a low-pass Bessel (8-pole) filter. (B) Log-binned distributions of the open time τon obtained with 20 nM α-syn at +30 mV for hVDAC3 and mVDAC1 and acquired from statistical analysis of the corresponding current records. Solid lines are logarithmic single-exponential fittings with characteristic times <τon> equal to 107.3 and 6.1 ms for hVDAC3 and mVDAC1, respectively. Norm., normalized. (C) Voltage dependences of the on-rate constant kon of α-syn binding to hVDAC3 and mVDAC1. The solid lines represent a fit to Boltzmann equation kon(V) = k0 exp [nbe|V|/(kBT)], where V is the applied voltage, nb is the effective binding charge of 2.6 ± 0.3, and e, kB, and T have their usual meaning of elementary charge, Boltzmann constant, and absolute temperature, respectively. (D) Voltage dependences of the mean blockage time τoff obtained for hVDAC3 and mVDAC1. The increase of τoff with voltage amplitude corresponds to the α-syn blockage/retraction regime; the decrease of τoff with voltage amplitude (highlighted in yellow) corresponds to the regime of α-syn translocation through the pore. V* indicates the voltage separating the two regimes. Data are means of three to four experiments ± SD. Membranes were formed from mixtures of DOPC/DOPE/2DOPG, and membrane bathing solutions contained 1 M KCl buffered with 5 mM HEPES at pH 7.4.

