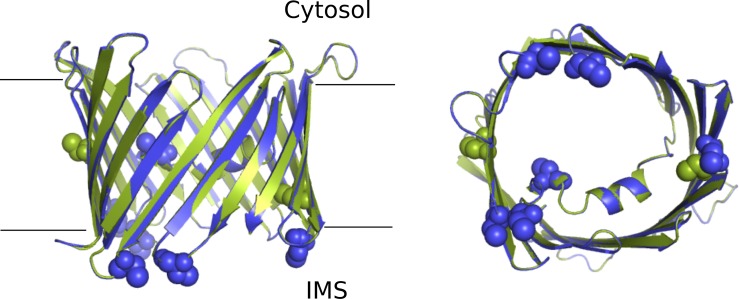
Figure S1.
Schematic representation of mVDAC1 and a model of hVDAC3. Schematic representation of mVDAC1 (green, PDB accession no. 3EMN) and a model of hVDAC3 (blue), from the membrane plane (left), and from the intermembrane space (IMS, right). The cysteine residues are presented as spheres.

