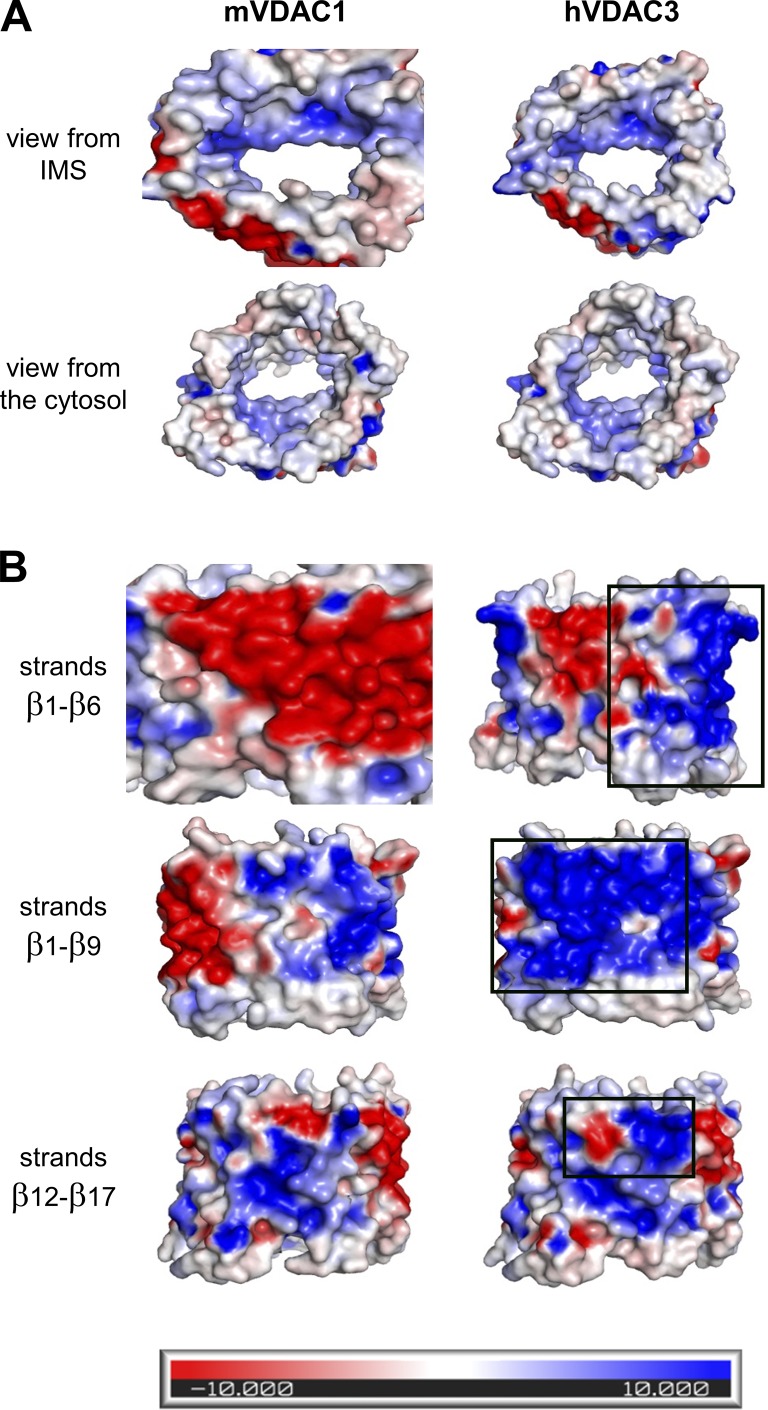
Figure S2.
Side-by-side comparison of electrostatic potential maps of mVDAC1 (left) and hVDAC3 (right). (A) View of the pore interior. (B) View of the membrane domain. Black rectangles correspond to the area of most changes. These maps were generated using the APBSmem program, which takes into account the low dielectric constant of the hydrophobic membrane. Blue represents a positive potential, and red, a negative potential.

