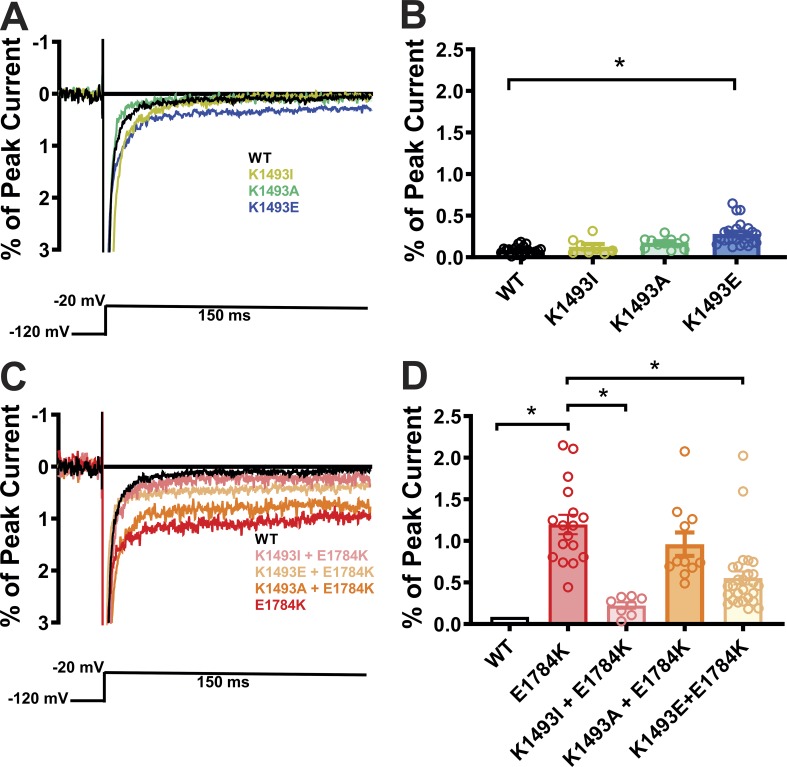
Figure 3.
Mutations at the putative interaction site lead to an increased persistent current. (A and C) Exemplar traces displaying the persistent currents in WT and mutant VGSCs. (B and D) Quantified data of persistent currents from WT and mutant VGSCs. Gray column with black outline in D represents the WT data from B (common for both, with graphs on a different scale). *, P < 0.05.

