Figure 4.
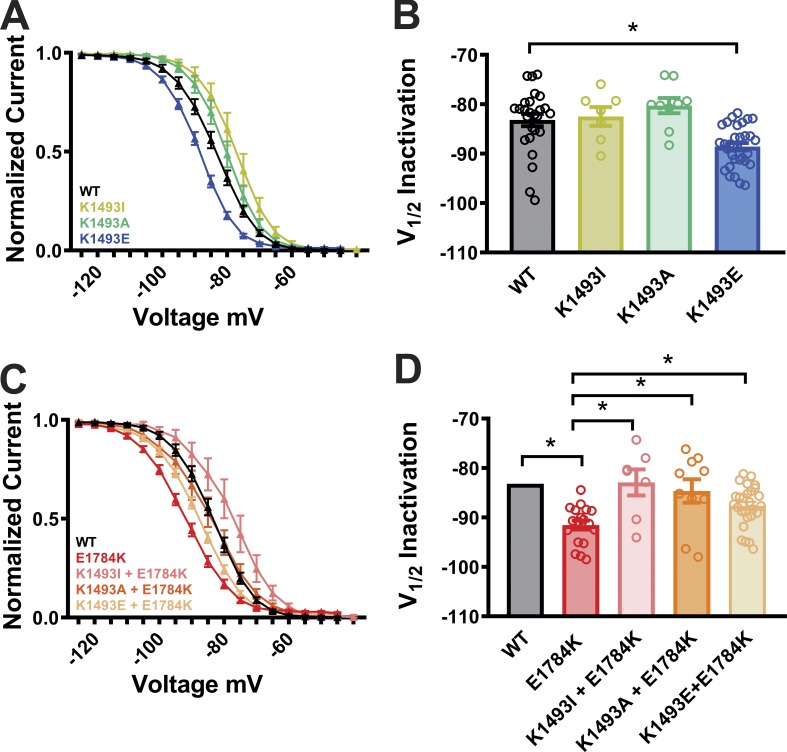
Mutations at the putative interaction site lead to hyperpolarized shift in steady-state inactivation. (A and C) Steady-state inactivation curves from WT and mutant channels. (B and D) Quantified data of V1/2 of inactivation from WT and mutant channels. Gray column with black outline in D represents the WT data from B (common for both). *, P < 0.05.

