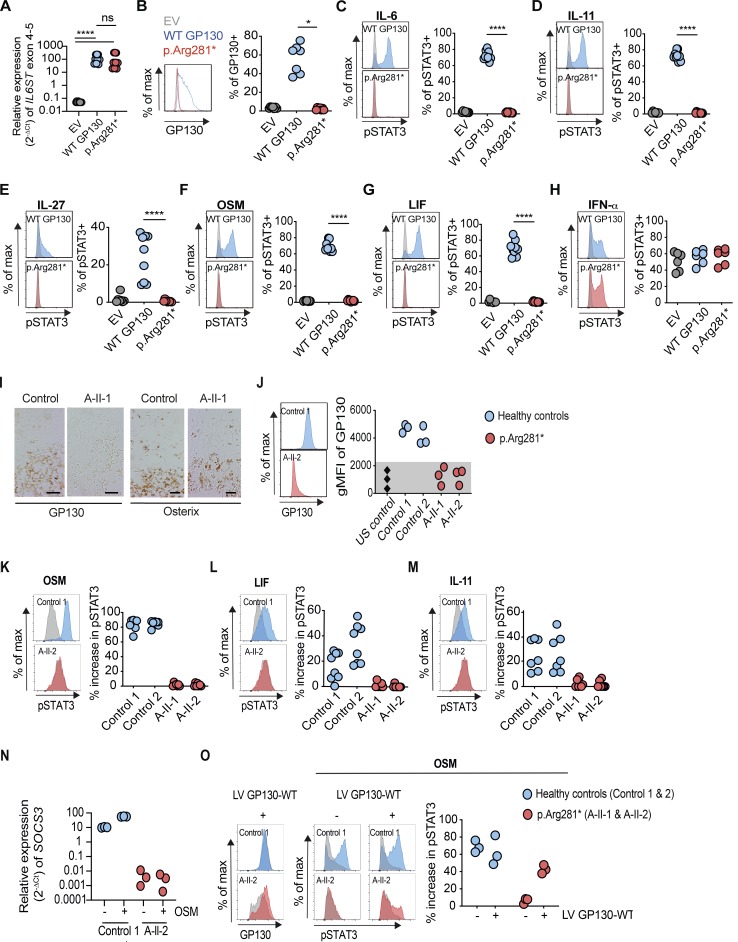
Figure 2.
Homozygosity for IL6ST p.Arg281* variant completely abrogates GP130-dependent IL-6, IL-11, IL-27, OSM, and LIF signaling. (A) Gene expression (2−ΔCt) of IL6ST exons 4–5 from p.Arg281* transfected GP130-deficient HEK293 cells 24 h after transfection, relative to endogenous control gene RPLPO. Data represent nine technical repeats from three independent experiments. (B) GP130 surface expression in p.Arg281* transfected GP130-deficient HEK293 cells. Results are representative of seven independent experiments. (C–H) Response of pSTAT3 in p.Arg281* transfected GP130-deficient HEK293 after stimulations with IL-6, IL-11, IL-27, OSM, LIF, and IFN-α stimulation (all 100 ng/ml for 15 min). For assessment of IL-6 and IL-11 signaling, cells were cotransfected with plasmids encoding IL-6Rα and IL-11Rα, respectively. Successfully transfected cells were gated based on GFP expression. Representative histograms are shown on the left (gray, unstimulated; blue and red, stimulated). Quantification is based on six independent experiments per cytokine, with one to two replicates per experiment. (A–H) EV, empty vector; WT GP130, wild type. Statistical differences were determined by means of Mann–Whitney U test, ****, P ≤ 0.0001; *, P ≤ 0.05. (I) Immunostaining of the growth plate and primary spongiosa with absent GP130 expression and normal osterix at the border of the hypertrophic zone of A-II-1 compared with an age-matched control fetus. Scale bar indicates 50 µm. (J) GP130 expression in amniocytes from patient A-II-1 or A-II-2 compared with healthy controls by flow cytometry. Geometric mean fluorescence intensity (gMFI) values are shown from representative histograms (left), and dot plots summarize data from three experiments (right). US, unstained. (K–M) Response of pSTAT3 in A-II-1 or A-II-2 amniocytes after stimulations with OSM, LIF, or IL-11 (all 100 ng/ml for 15 min) compared with healthy controls (gray, unstimulated; blue and red, stimulated). Representative histograms (left) are shown with percentage increase of pSTAT3 in cytokine-stimulated cells determined by comparison with unstimulated cells (right). Dot plots summarize data from five experiments per cytokine (right), with one to two replicates per experiment. (N) Gene expression (2−ΔCt) of SOCS3 from amniocytes in the presence or absence of OSM (100 ng/ml) for 24 h, relative to endogenous control gene RPLPO. Data represent measurements from two experiments. (O) GP130 surface expression after lentiviral transduction with WT GP130. Representative histograms of control 1 and A-II-2 are shown on the left (gray, untransduced; blue and red, transduced). Response of pSTAT3 after OSM stimulation (100 ng/ml for 15 min) in control and patient amniocytes that were infected with or without GP130-expressing lentivirus (gray, unstimulated; blue and red, OSM). Three experiments were performed on cells from healthy controls and patients. LV, lentivirus.

