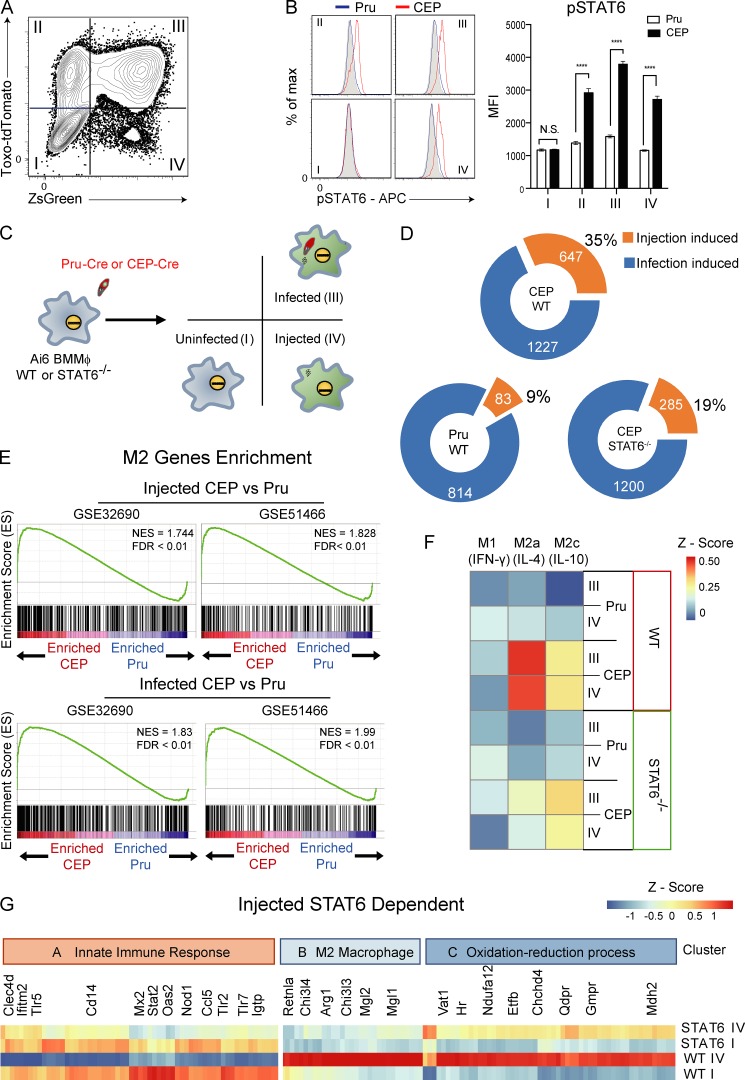
Figure 1.
Impact of injection and infection on macrophage phenotype in vitro. (A) Primary BMMøs from Ai6 mice were challenged with CEP-Cre-tdTomato, and at 24 hpi they were analyzed by flow cytometry for expression of tdTomato and ZsGreen. Populations were divided into fractions I (uninfected), II, III (infected), and IV (injected). Representative flow plot from one of four independent experiments (n = 3 replicates/experiment). (B) BMMøs from Ai6 mice were challenged with CEP-Cre-tdTomato or Pru-Cre-tdTomato, and fractions I–IV were assessed for pSTAT6 (gray, fluorescence minus one [FMO]; blue, Pru; red, CEP). Bar graphs depict the mean fluorescence intensity (MFI) of pSTAT6 in each fraction. Summary data from one of three independent experiments (n = 3 replicates/condition/experiment). (C) Experimental plan for transcriptional profiling of Ai6 BMMøs of the WT or STAT6−/− BMMøs infected with Pru-Cre-tdTomato or CEP-Cre-tdTomato strains. After 20 hpi, fractions I, III, and IV were sorted for microarray analysis. (D) Donut charts that show the numbers of genes altered by injection or infection for Pru and CEP and the impact of STAT6 on the changes induced by CEP. The numbers in each circle indicate total genes in set (orange, injection-specific induced; blue, infection-specific induced). (E) GSEA enrichment plots of Pru and CEP infected or injected cells showing enrichment of up-regulated M2 genes (GEO accession nos. GSE32690 and GSE51466). Enrichment score refers to the degree to which the gene set is overrepresented at the top or bottom of the ranked input list of genes. NES, normalized enrichment score (adjusted for gene set size or multiple hypothesis testing). (F) BMMøs were stimulated in culture with IFN-γ (M1), IL-4 (M2a), or IL-10 (M2c) for 24 h, and RNA sequencing was performed to generate gene signatures associated with these cytokines. The datasets generated in C were then compared with the M1, M2a, and M2c signatures, and differences were expressed as a heat map. (G) Identification of the CEP injection-induced STAT6-dependent gene profile. Cluster A genes associated with the innate immune response were inhibited by injection, while cluster B (M2) and C (oxidation-reduction processes) genes were promoted by injection. Summary statistics represent mean ± SD; ****, P < 0.0001 (two-tailed unpaired Student’s t test). FDR, false discovery rate.

