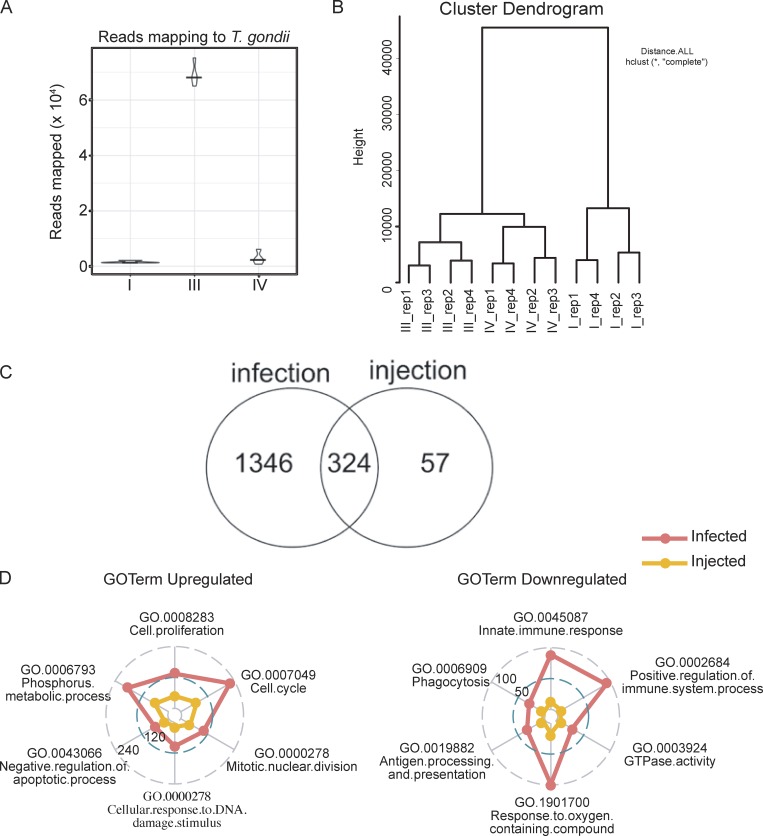
Figure S2.
Gene expression analysis of LPM from CEP-infected mice. (A) Reads that map to parasite transcriptome from sorted populations of uninfected (I), infected (III), and injected (IV) at 1 dpi with CEP. (B) Hierarchically clustered sorted samples from four replicated (rep) samples with dendrograms from infected Ai6 mice. (C) Numbers of DEGs induced by infection or injection. (D) Quantitative radar plot representation of the degree of enrichment of GO terms for major immune cell subsets using the DAVID online tool. Numbers represent the number of enrichment genes and provide an overall comparison of the infected versus injected populations. Fig. S2 is related to Fig. 2.

