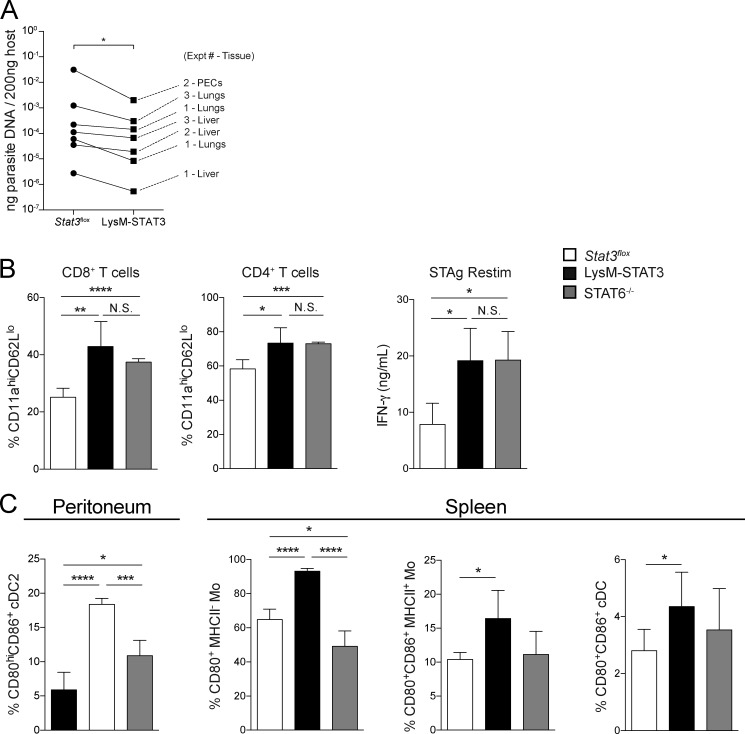
Figure S3.
Analysis of STAT6−/− and LysM-STAT3 mice during CEP infection. (A) Stat3flox or LysM-STAT3 mice were infected i.p. with 105 CEP-Cre-tdTomato, and on 5 dpi parasite burden from the liver, lung, and PECs was measured by quantitative PCR. The amount of parasite DNA measured per 200 ng of host DNA in each tissue was averaged for all the mice of each genotype in each experiment and plotted pairwise across the Stat3flox and LysM-STAT3 genotypes. Summary data of all the tissues measured in three independent experiments were compared between Stat3flox and LysM-STAT3 groups by Wilcoxon test (n = 4–5 mice/genotype/experiment). (B–D) Stat3flox, LysM-STAT3, or STAT6−/− mice were infected i.p. with 105 CEP-Cre-tdTomato, and at 10 dpi, the adaptive and innate responses were measured. (B) Numbers of activated (CD11aHICD62LLO) CD8+ and CD4+ T cells in the spleen were measured by flow cytometry (mean ± SD). (C) Splenocytes were stimulated with STAg for 72 h, and IFN-γ production was measured by ELISA (mean ± SD). (D) The fraction of cDC2 in the peritoneum and monocytes and cDC in the spleen that were activated (CD80+CD86+) was measured by flow cytometry (mean ± SD). Summary data from one of two independent experiments (n = 4–5 mice/genotype). Summary statistics represent mean ± SD; *, P < 0.05; **, P < 0.01; ***, P < 0.001; ****, P < 0.0001 (two-tailed unpaired Student’s t test). Fig. S3 is related to Fig. 3.

