Figure 3.
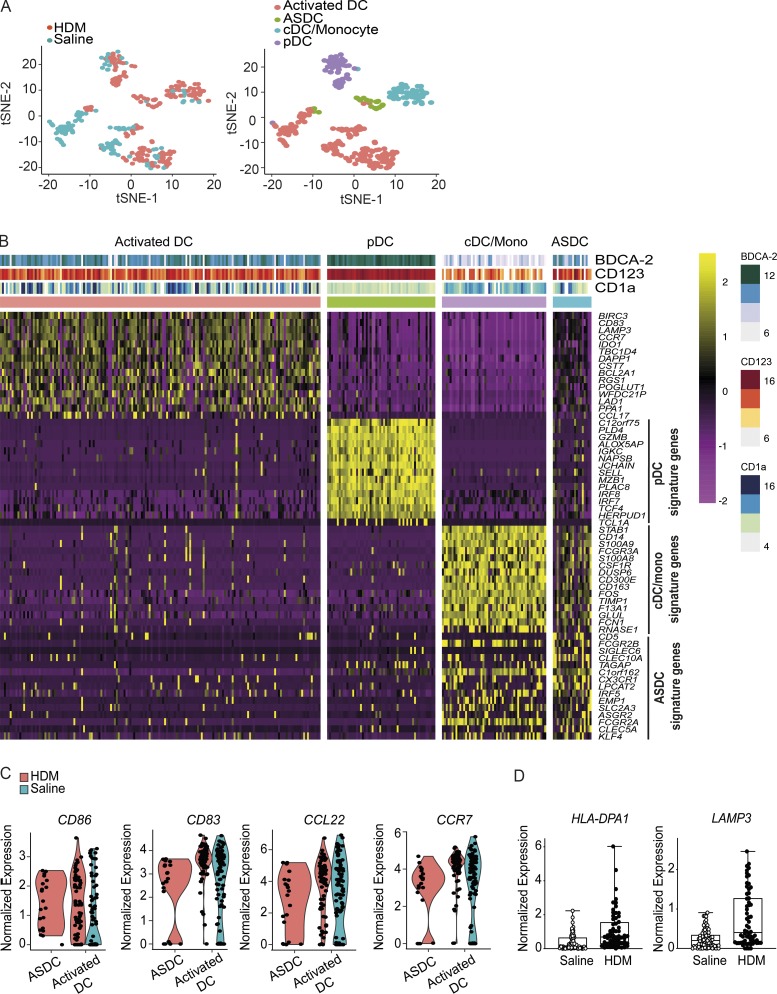
Human HDM blister-derived BDCA-2+ DC heterogeneity analysis by scRNA-seq. (A) 180 cells were successfully profiled from HDM-challenged skin blisters from a single donor, and unbiased t-SNE analysis of all DC subsets isolated from saline and HDM blisters is shown. Each dot represents an individual cell. (B) Heatmap colored by normalized gene expression in individual cells of each cluster. Top margin color bars report the index fluorescent values of CD123, BDCA-2, and CD1a. Mono, monocyte. (C) Violin plots demonstrate the expression distribution of indicated genes across ASDCs and activated DCs. Each dot represents an individual cell. (D) HLA-DPA1 and LAMP3 expression of activated DCs from saline- and HDM-challenged blisters. Boxes show 25–75% percentiles; whiskers show minimum to maximum.

