Figure 5.
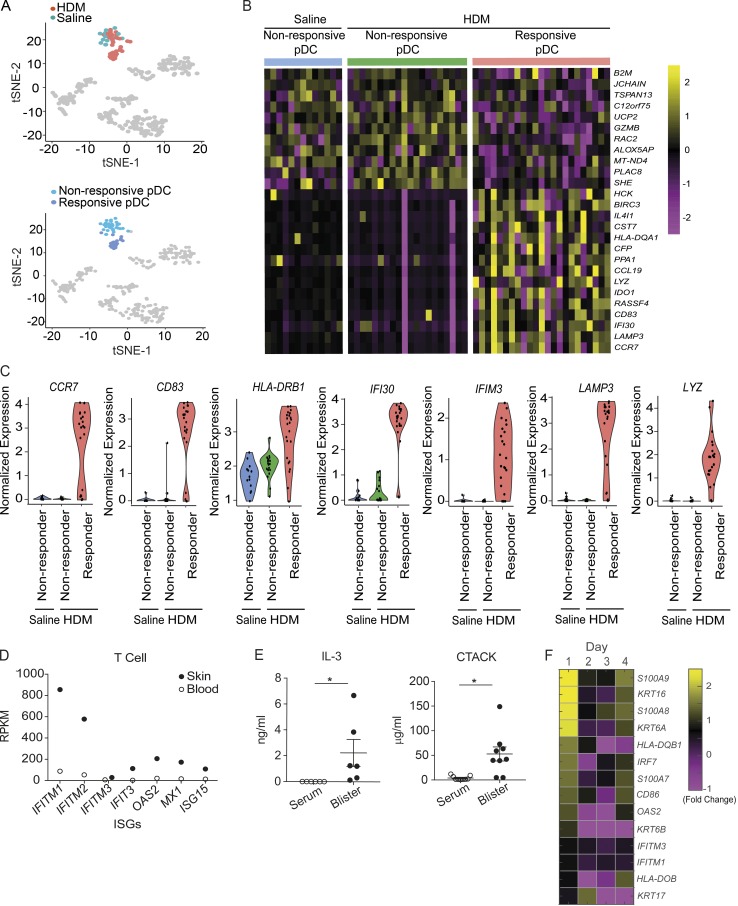
Skin-infiltrating pDCs and their relevant cytokines can be found in skin suction blisters. (A) t-SNE analysis of pDCs isolated from saline and HDM blisters is shown. Each dot represents an individual cell. (B) Heatmap colored by normalized gene expression in individual cells for pDC status. (C) Violin plots demonstrate the expression of indicated genes across pDCs from saline- and HDM-challenged blisters. Each dot represents an individual cell. (D) T cells were isolated from skin suction blisters or blood and subjected to RNA sequencing analysis. Reads of skin-infiltrated cells were compared with those of blood counterparts. RPKM, reads per kilobase of transcript per million mapped reads. (E) Concentration of CTACK and IL-3 in the blister fluid or serum was evaluated by multiplex bead array. Data are pooled from six to nine donors. Error bars show mean and SEM. (F) Targeted RNA sequencing was performed on skin biopsies collected at day 0 to day 4 after bilateral skin wounds on the flank from healthy volunteers. Heatmap colored by log fold-change values for genes on each day after wounding. Average result of an experiment using three skin biopsies at each day is shown.

