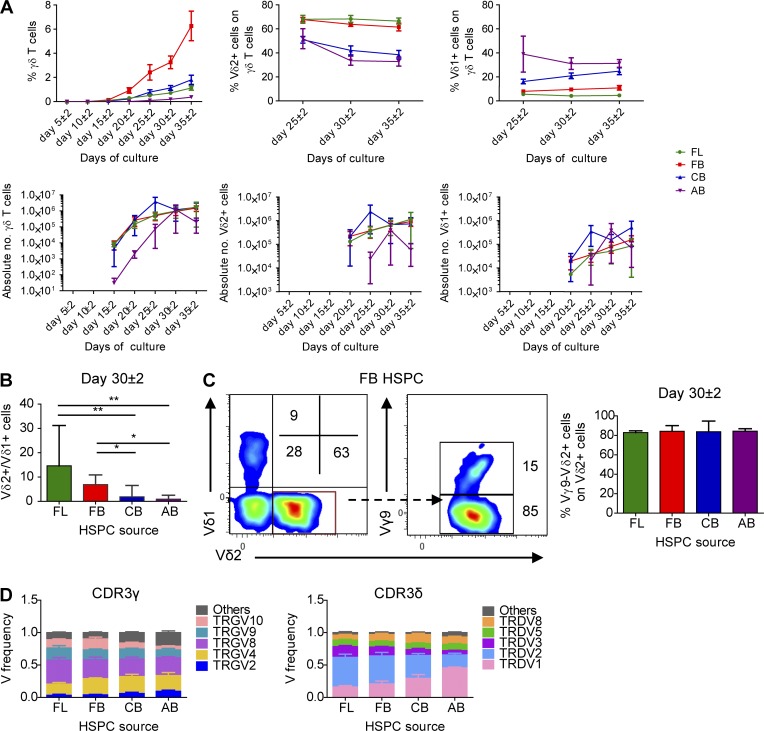
Figure 4.
Human fetal HSPCs efficiently generate Vγ9−Vδ2+γδ T cells. (A) Kinetics of the percentage of γδ T cells (of CD7+ cells), Vδ2+, and Vδ1+ γδ T cells (top) and of the absolute number (bottom) analyzed by flow cytometry and derived from FL, FB, CB, and AB HSPCs during co-culture with OP9DL1 cells. For each time point, n ranges from 2 to 3 (FL), 6 to 9 (FB), 7 to 11 (CB), and 3 to 4 (AB). (B) Ratio between Vδ2+ versus Vδ1+ γδ T cells at day 30 ± 2 of OP9DL1 co-culture (n = 3, 9, 11, and 4, respectively, for FL-, FB-, CB-, and AB-derived HSPCs). (C) Flow cytometry analysis of the expression of Vδ2 and Vδ1 chains of γδ T cells derived from FB HSPCs and of the expression of the Vδ9 chain on the Vδ2+ γδ T cells at day 30 ± 2. Numbers indicate the percentage of the corresponding population. Data are representative of 11 independent experiments. On the right, percentage of the Vγ9-Vδ2+ γδ T cell subset (gated on Vδ2+ γδ T cells) from FL, FB, CB, and AB HSPCs at day 30 ± 2 of OP9-DL1 co-culture (n = 3, 9, 11, and 4, respectively, for FL, FB, CB, and AB). (D) HTS analysis of the V gene segment usage TRGV (left) and TRDV (right) of sorted γδ T cells derived from FL (n = 3), FB (n = 4), CB (n = 6), and AB (n = 3) HSPCs. TRG “Others” groups: TRGV1-TRGV3, TRGV5, TRGV5P, TRGV7, and TRGV11 variable chains; TRD “Others” groups: TRDV4, TRDV6, and TRDV7 variable chains. Graphs show the means ± SEM (A and D) or the medians ± range (B and C). Data were analyzed by Kruskal-Wallis ANOVA followed by Dunn’s multiple comparison test; *, P < 0.05; **, P < 0.01.

