Figure 7.
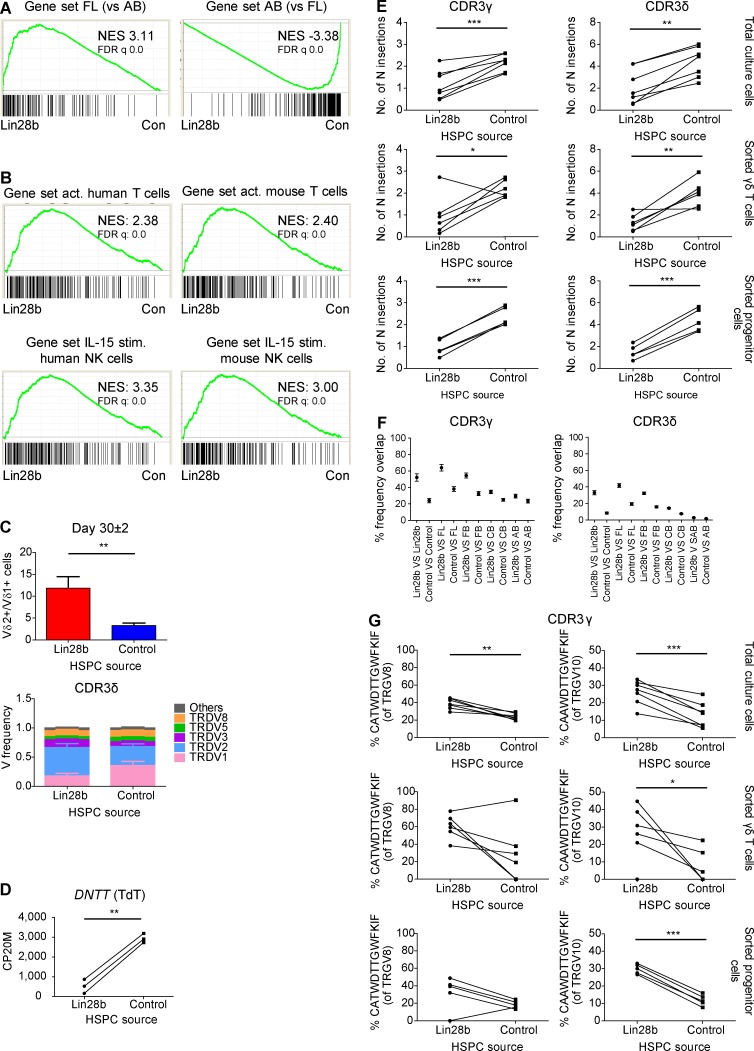
Lin28b induces an effector program, inhibits TdT expression, and enhances the formation of germline-encoded invariant CDR3γ and CDR3δ sequences. (A) γδ T cells were sorted from OP9DL1 cultures either derived from Lin28b-transduced CB HSPCs (Lin28b; n = 3) or control-transduced CB HSPCs (Con.; n = 3). GSEA plots based on RNAseq data quantifying the shared profiles of Lin28b-derived versus control-derived γδ T cells with FL and AB HSPC-derived γδ T cells as gene sets. (B) GSEA plots quantifying the shared profile of Lin28b- versus control-transduced CB HSPC-derived γδ T cells with activated (act.; versus naive) human (GSE28726) and mouse (GSE10239) T cells (top) and with IL-15–stimulated (stim.; versus unstimulated) human (GSE22886) and mouse (GSE7764) NK cells (bottom). Gene sets are from the C7 immunological gene signature from the MSigDB. NES, normalized enrichment score. (C) Top, ratio between Vδ2+ and Vδ1+ γδ T cells derived from Lin28b-transduced CB HSPCs (Lin28b) and from control-transduced CB HSPCs (control) at day 30 ± 2 of OP9DL1 co-culture as determined by flow cytometry (n = 9 for Lin28b and control). Bottom, HTS analysis of the TRDV usage on sorted γδ T cells from Lin28b- and control-transduced CB HSPCs. “Others” groups: TRDV4, TRDV6, and TRDV7 variable chains (n = 5). (D) Paired comparison analysis of the CP20M RNAseq data of DNTT (TdT) expressed in γδ T cells derived from Lin28b- versus control-transduced CB HSPCs. (E) Mean number of N insertions in CDR3γ and CDR3δ repertoires of total cells, sorted γδ T cells, and sorted progenitor cells derived from Lin28b- versus control-transduced CB HSPCs. (F) Overlap analysis showing the percentage of shared CDR3γ and CDR3δ clonotypes among sorted γδ T cells (n = 6) derived from Lin28b- versus control-transduced CB HSPCs and among these samples with three FL, four FB, six CB, and three AB sorted γδ T cells derived from HSPCs. (G) Percentage of particular CDR3 clonotype amino acid sequences present in total cells, sorted γδ T cells, and sorted progenitor cells derived from Lin28b- versus control-transduced CB HSPCs. Lines between symbols link samples from the same subject (D, E, and G). Data are means ± SEM (C and F). Data were analyzed by paired Student’s t test; *, P < 0.05; **, P < 0.01; ***, P < 0.001.

