Figure S1.
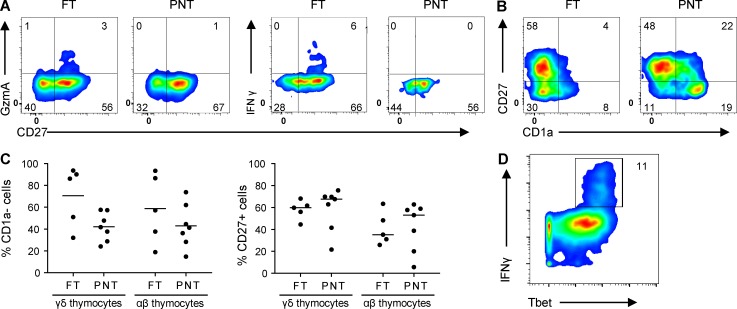
Flow cytometry data on FT and PNT thymocytes. (A) Flow cytometry plots of FT and PNT γδ thymocytes illustrating the expression of granzyme A+ cells (left) and IFNγ+ cells (right) within mature CD27+ cells. (B) Flow cytometry plots illustrating the inverse relation of the expression of CD27 and CD1a maturation markers in FT and PNT γδ thymocytes. (C) Flow cytometry analysis of CD1a− (left) and CD27+ (right) expression by fetal and postnatal γδ and αβ thymocytes. (D) Cytometry plot (based on CyToF data) of fetal γδ thymocytes illustrating IFNγ+ cells within Tbethigh cells. Representative of five (FT) and six (PNT) independent experiments (A, left; and B) or representative of one (FT) and seven (PNT) independent experiments (A, right). Horizontal lines indicate medians. Flow cytometry plots (A and B) and data (C) represent FT and PNT γδ thymocytes without the Vγ9Vδ2 subset.

