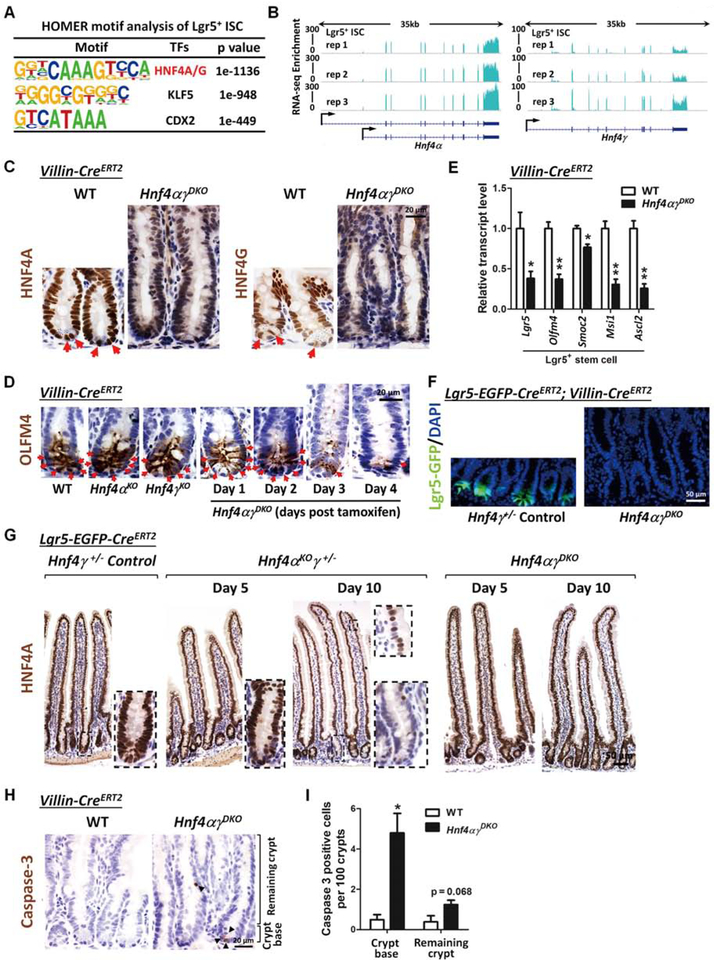
Figure 3. Loss of HNF4 paralogs in the intestinal epithelium triggers Lgr5+ stem cell loss.
(A) ATAC-seq of isolated intestinal stem cells reveals that HNF4A and HNF4G DNA-binding motifs (HOMER de novo) are most abundant at accessible chromatin regions of intestinal stem cells (GSE83394, n=2 biological replicates). (B) RNA-seq tracks of Hnf4α and Hnf4ɣ transcript levels in the intestinal stem cells (GSE83394, n=3 biological replicates) show robust expression of these paralogs. (C) Immunostaining of HNF4A and HNF4G in WT and Hnf4αɣDKO (representative of 3 biological replicates). (D) Immunostaining of OLFM4 (stem cell marker). Stem cells (red arrows) are lost in the crypts following Hnf4α and Hnf4ɣ double knockout. (E) qRT-PCR shows a significant decrease in the Lgr5+ stem cell markers in Hnf4αɣDKO. Crypts were isolated from duodenal epithelium of Hnf4αɣDKO and their WT littermates after 2 consecutive days of tamoxifen or vehicle injection, respectively. qPCR data are presented as mean ± SEM (n=3 biological replicates, Student’s t-test, two-sided at P < 0.01** and P < 0.05*). (F) Lgr5-GFP+ cells are observed in the crypt bottom of control mice, but are completely lost in Hnf4αɣDKO after 4 days of tamoxifen-induced knockout (representative of 3 biological replicates). (G) Immunostaining of HNF4A shows that Cre-mediated recombination of the Hnf4α locus is initiated via Lgr5-EGFP-CreERT2 ( a stem cell-specific Cre driver).However, most recombined HNF4A-negative cells are not preserved in the epithelium of the Hnf4αɣDKO mice (representative of 3 biological replicates), suggesting that Hnf4αɣDKO mutant stem cells are replaced by neighboring cells. (H) Immunostaining of cleaved Caspase-3 in WT and Hnf4αɣDKO. (I) Hnf4αɣDKO shows a significant increase of cleaved Caspase-3 postive cells in the crypt base of Hnf4αɣDKO compared to WT littermates. Data are presented as mean ± SEM (n=3–4 biological replicates, Student’s t-test, two-sided at P < 0.05*).

