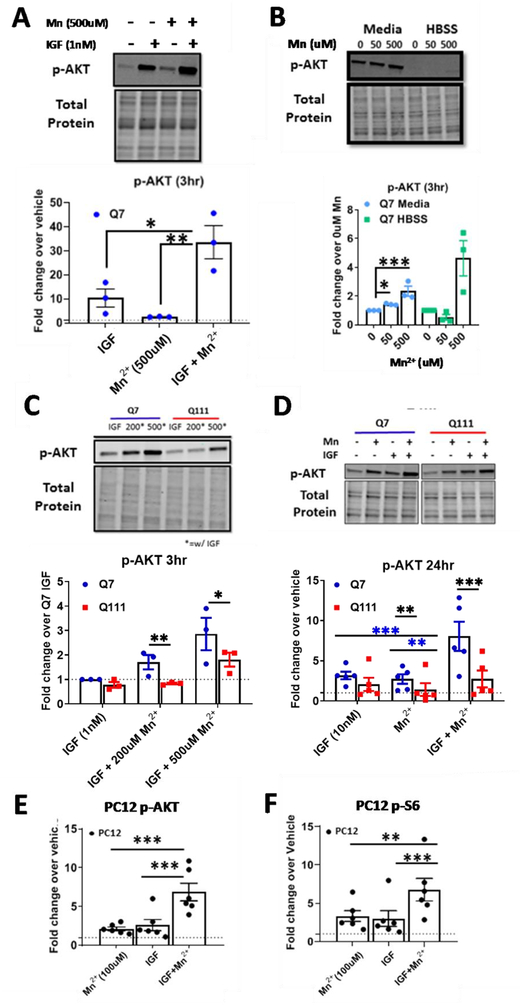
Figure 1: Mn2+ can potentiate IGF-1 induced p-AKT and Mn2+-induced p-AKT is reduced in HD cells.
A) p-AKT expression in STHdh Q7/Q7 following a 1hr serum deprivation, then 3hr exposure in HBSS with 1nM IGF-1 and/or 500μM Mn2+. Vehicle=dotted line. One-way ANOVA; treatment= F(2,6)=20.12; p=0.0022. B) Quantification of p-AKT after 3hr, 50/500μM Mn2+ exposure in serum free HBSS (following 1hr serum deprivation) or media containing 10% FBS. Two-way ANOVA; treatment= F(2,6)=40.84; p=0.0003; media/HBSS= F(1,3)= 671.6; p=0.0001; treatment-media interaction= F(2,6)= 24,37; p=0.0013. C) p-AKT expression in STHdh WT and HD cells following 1hr serum deprivation then 3hr Mn2+ (0/200/500μM) + IGF (1nM) exposure in HBSS. Two-way ANOVA; treatment= F(2, 4)= 10.29; p=0.0265. D) p-AKT expression after 24hrs treatment with 10nM IGF-1, 50μM Mn2+, or both in STHdh Q7/Q7 and Q111/Q111. Two-way ANOVA; treatment= F(2,10)=40.84; p=0.0064; genotype= F(1,5)= 671.6; p=0.0163; treatment-genotype interaction= F(2,10)= 1.587; p=0.2515. E,F) p-AKT (Ser473) and p-S6 (Ser 235/236) in uninduced PC12 cells following treatment with 100μM Mn2+, 10nM IGF-1, or both. For these PC12 experiments, all uninduced (i.e. were only expressing WT rat HTT) samples from the 23Q, 74Q, and 140Q (3 biological replicates each) were used. Representative blot Supp Fig 1C. One-way ANOVA; p-AKT treatment= F(2,10)=36.71; p=<0.0001; One-way ANOVA; p-S6 treatment= F(2,10)=20.57; p=<0.0003; Error bars= SEM. Dotted line= vehicle (=1). N=3 for Panel A-C; N=4 for panel D; N=5 for panel E; N=6 for panels F and G. *= significant by Tukey’s (A, F, G), Dunnet (B), and Sidak multiple comparison (D-E). *P<.05, **P<.01, ***P<.001.

