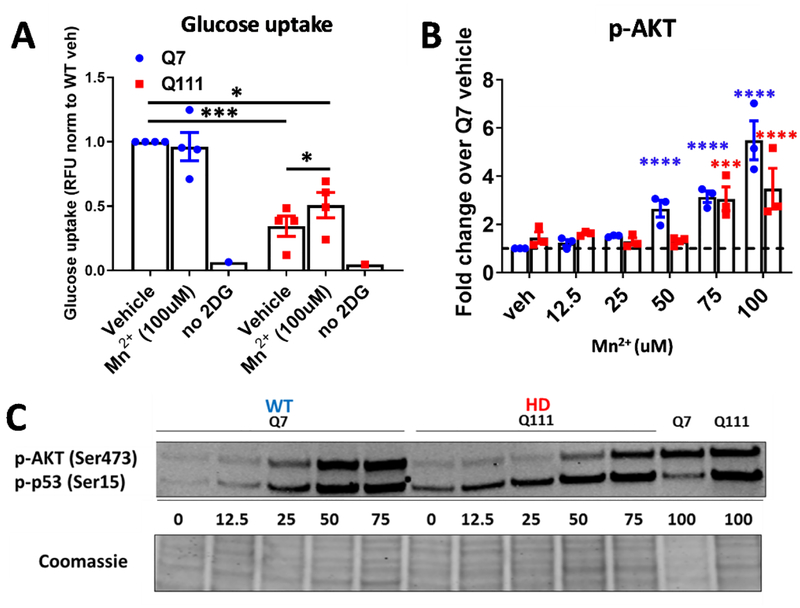
Figure 10: Mn2+ increases glucose uptake in Q111 cells.
A) Quantification of glucose uptake in STHdh Q7/Q7 and Q111/Q111 following 24hr exposure with 50/100μM Mn2+. “no 2DG” is a negative control in which no glucose was added to cells. N=4; Error bars= SEM. Two-way ANOVA; treatment= F(2,6)=1.443 p=<0.3079; genotype= F(1,3)= 5.585 p=0.0991; treatment-genotype interaction= F(2,6)= 5.939 p=.0370. *= significance by Tukey’s multiple comparison test. B) Quantification of p-AKT (p-p53 is not quantified) across 12.5–100uM Mn exposure. Two-way ANOVA; treatment= F(5,10)=29.75; p=<0.0001; genotype= F(1,2)=35.45; p=0.0271. *= significant by Sidak’s multiple comparison. *P<.05, **P<.01, ***P<.001. C) Representative western blot of p-AKT and p-p53 after 24hr Mn exposure with 12.5–100uM in WT and HD STHdh cells

