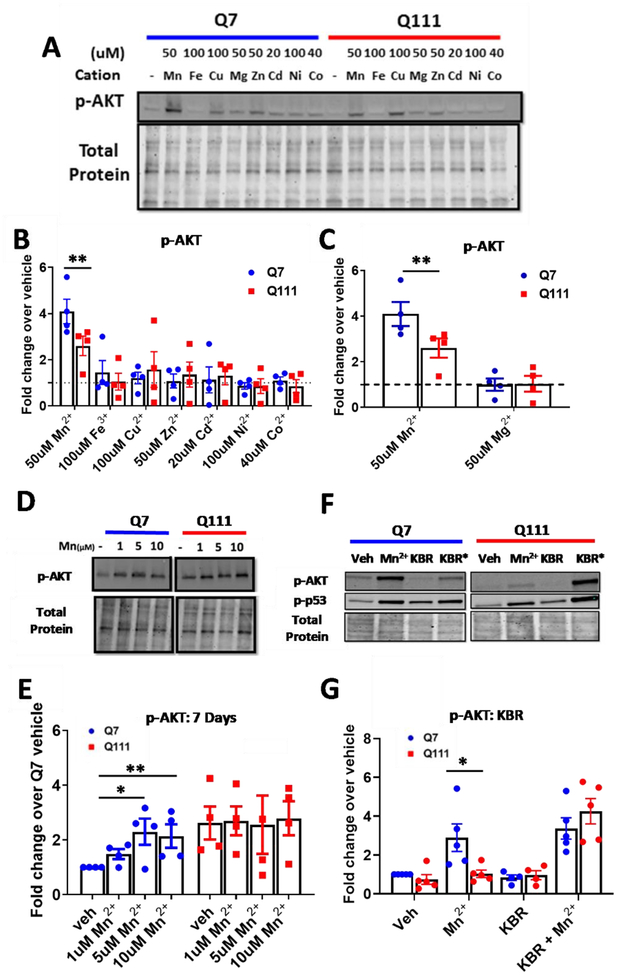
Figure 2: Assessing the specificity and dynamics of the Mn2+-AKT interaction.
A) Representative blot for p-AKT expression in STHdh Q7/Q7 and Q111/Q111 cells following 24hr exposures with Mn2+, Fe3+, Cu2+, Mg2+, Zn2+, Cd2+, Ni2+, or Co2+. B) Quantification of p-AKT expression, blot shown in panel A. C) Quantification of only Mn2+ and Mg2+-induced p-AKT after 24hrs, blot shown in panel A. Two-way ANOVA; treatment= F(8, 24)=2.509; p=<0.0388. N=4; Error bars= SEM; Normalized to respective vehicle. D) Representative blot for p-AKT and p-S6 expression in STHdh Q7/Q7 and Q111/Q111 cells following 7-day exposure with Mn2+ (1/5/10μM) or IGF (10nM). E) Quantification of p-AKT expression, blot shown in panel D. N=4. Error=SEM. Two-way ANOVA; treatment= F(3,9)=.5284; p=0.6738; genotype= F(1,3)= 33.39; p=0.0103; treatment-genotype interaction= F(3,9)= 4.912; p=0.0273. F) Representative blot for p-AKT and p-p53 expression following 24hr exposure with 50μM Mn2+, 10μM KB-R7943, or both. G) Quantification of p-AKT expression, blot shown in panel H (p-p53 quantification not shown). Two-way ANOVA; treatment= F(3,12)=24.91; p=<0.0001; genotype= F(1,4)= 2.840 p=0.1672; treatment-genotype interaction= F(3,12)= 4.761; p=0.0207. N=4; Error bars= SEM. *= significant by Dunnet (B, C, E), and Sidak multiple comparison tests (G,H). *P<.05, **P<.01, ***P<.001.

