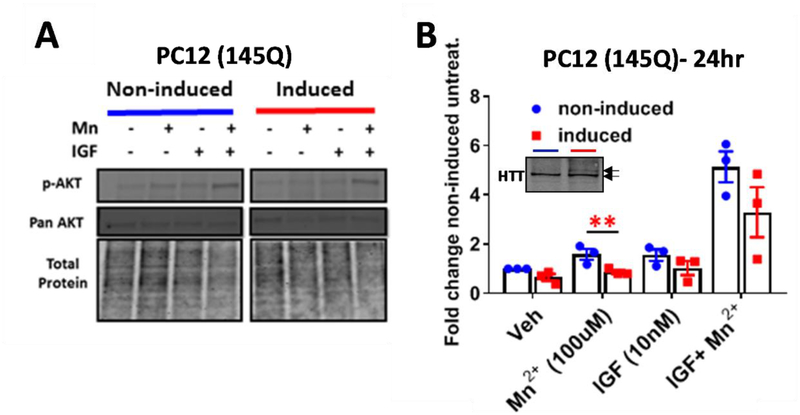
Figure 3: Assessing the effects of WT and mutant HTT in Mn2+-induced pAKT.
A) Representative western blot of PC12 cells in differentiated and 145Q HTT-induced PC12 cells following 24hr exposure with 100μM Mn2+ and/or IGF (10nM) B) Quantification of p-AKT expression. 145Q induced HTT cells (red) are compared to uninduced counterparts (blue). Image of WT HTT (bottom arrow) and 145Q HTT (top arrow) expression using mAb 2166 inset within graph- blue= non-induced, red= induced. N=3; Error bars= SEM, *= significance genotype difference by student’s t-test. *P<.05, **P<.01, ***P<.001.

