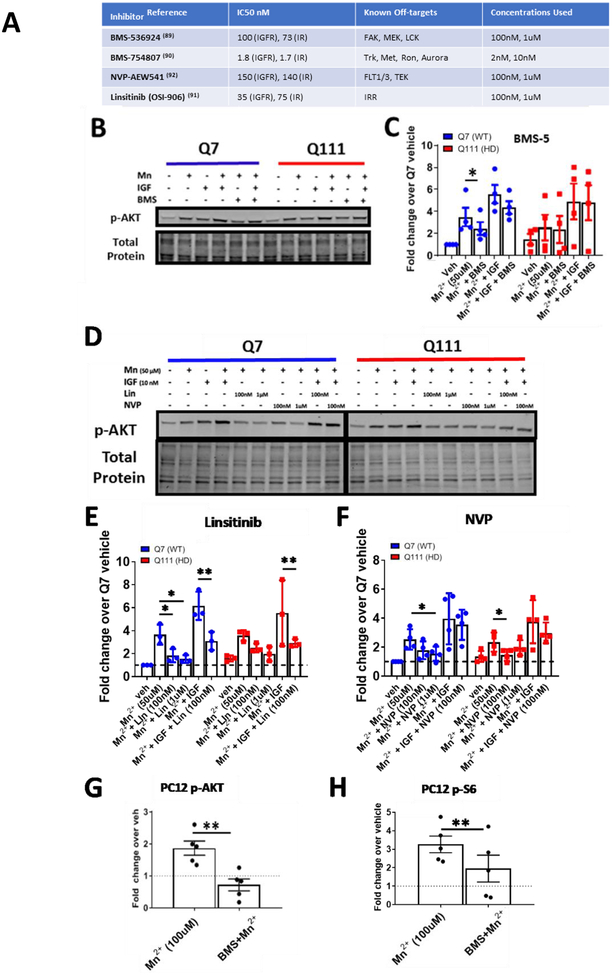
Figure 5: IR/IGFR inhibitors block Mn2+-induced p-AKT.
A) List of IR/IGFR inhibitor names, IC50s for IR/IGFR, off-targets, and concentrations used here. B) Representative western blot of pAKT expression STHdh Q7/Q7 and Q111/Q111 after 24hr treatment with Mn2+ (50μM), IGF (10nM), and/or BMS-536924 (100nM).C) Quantification of Mn2+/IGF induced p-AKT expression with BMS536924 (100nM). Two-way ANOVA for BMS5 treatment; F(1.610, 4.831)=20.03; p=.0039. N=4. D) Representative western blot of p-AKT expression in STHdh Q7/Q7 and Q111/Q111 after 24hr treatment with Mn2+ (50μM), Linsitinib (100nm/1μM), NVP-AEW541-AEW541 (100nM/1μM) and Mn2++IGF(10nM). E, F) Quantification of Mn2+/IGF-induced p-AKT expression with Linsitinib (E) or NVP-AEW541 (F) Two-way ANOVA for LLinsitinib treatment; F(4,8)=8.414; p=.0182; Two-way ANOVA for NVP treatment; F(4,8)=10.68; p=.0027. N=3–4. G, H) Quantification of p-AKT (G) and p-S6 (H) expression in uninduced PC12 cells treated with 100μM Mn2+ or Mn2+ (100μM) + BMS536924 (100nM) after 24hr exposures. Representative blot Supp Fig 1C. *= significance by student’s t-test. For these PC12 experiments, uninduced samples from the 23Q, 74Q, and 140Q (total N=5) were used. Note representative blot Supplemental Fig 1C. Error bars= SEM. Dotted line= Vehicle (=1). *P<.05, **P<.01, ***P<.001.

