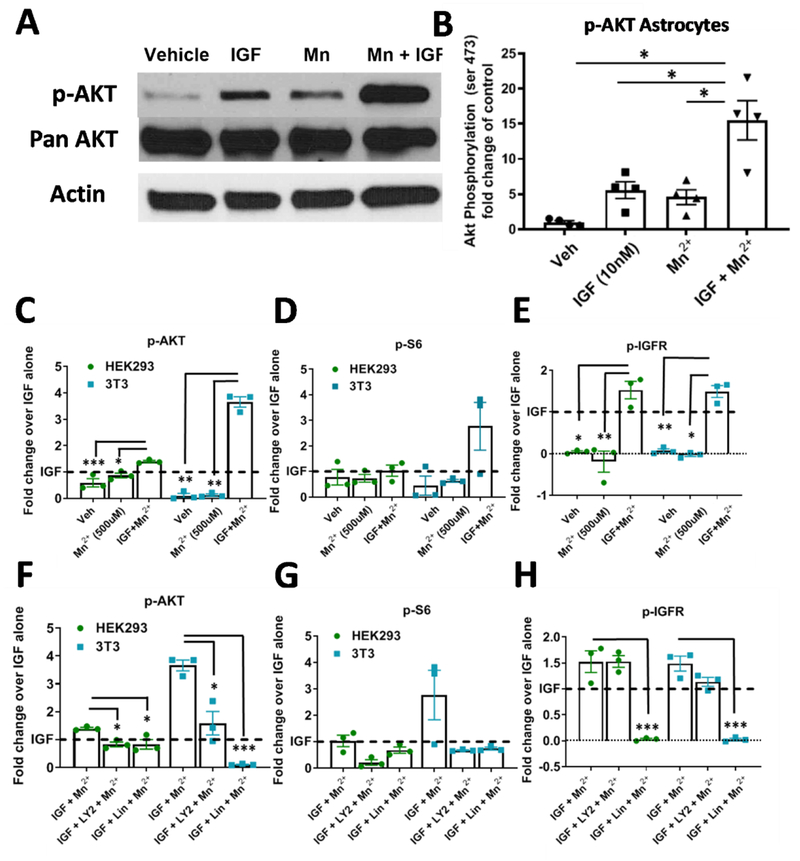
Figure 6: Mn2+ increases p-AKT and p-IGFR expression in the presence of IGF-1 in astrocytes and non-neuronal cell lines.
A, B) Representative western blot and quantification of p-AKT in astrocytes after 1hr serum deprivation followed by 3hr exposure with Mn2+ (500μM), IGF (1nM), or both. One-way ANOVA; treatment= F(1.167, 3.501)=24.37; p=<0.0104. N=4. Error= SEM. C-E) Quantifications of western blots of 3T3 and HEK293 p-AKT (C) p-S6 (D), p-IGFR (E) expression after 1hr serum deprivation followed by 3hr exposure in HBSS with Mn2+ (100μM), IGF (1nM), or both. F-H) Quantifications of western blots of 3T3 and HEK293 p-AKT (F), p-S6 (G), p-IGFR (H) expression after 1hr serum deprivation followed by 3hr exposure in HBSS with Mn2+ (100μM) + IGF (1nM) with LY294002 (7μM), and/or LLinsitinib (1μM). Representative blot in Supp. Fig 3. N=3; Error bars= SEM; Dotted line= IGF alone (=1). One-way ANOVA for p-IGFR; HEK: F(1.284, 2.568)= 38.12; p=.0129; 3T3: F(1.221, 2.442)=99.63; p=.0048. One-way ANOVA for p-AKT; HEK: F(4,8)= 9.391; p=.0041; 3T3: F(4,8)=8.544; p=.0055. One-way ANOVA for p-S6; HEK: F(1.274, 2.548)= 5.081; p=.1270; 3T3: F(1.014, 2.028)=3.123; p=.2180 *= significance by Dunnet’s multiple comparison test.*P<.05, **P<.01, ***P<.001.

