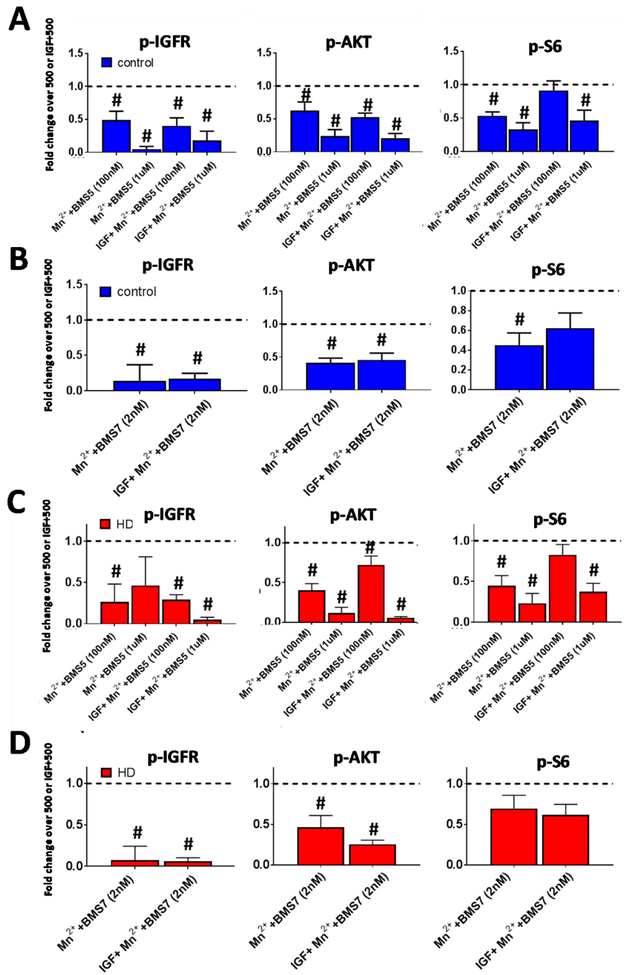
Figure 8: Mn2+-induced p-AKT, IGFR is blocked by IR/IGFR inhibition in HD hiPSC-derived neuroprogenitors.
Western blot quantification of control and HD patient iPSC-derived neuroprogenitors following treatment 3hr treatment with Mn2+ (500μM) or Mn2++IGF (1nM) in growth factor/insulin free media, after 3hr N2 supplement (insulin/growth factor) withdrawal. A-D) Quantification of p-IGFR, p-AKT, and p-S6 in control (Blue, A,B) or HD (Red, C,D) after treatment with BMS-536924 (100nM/1μM; A,C) or BMS-754807 (2nM; B,D). All data is represented as fold change compared to Mn2+ alone or Mn2++IGF (both normalized=1). Samples were from the exact same patient cell lines and differentiations as Figure 7. N=4–6 per condition across three control and three HD patients. Representative blot in Supplemental Fig 5.A,B. #= significant difference to Veh (dotted line=1 for -IGF conditions) or IGF alone (dotted line=1 for +IGF conditions) by 95% CI.

