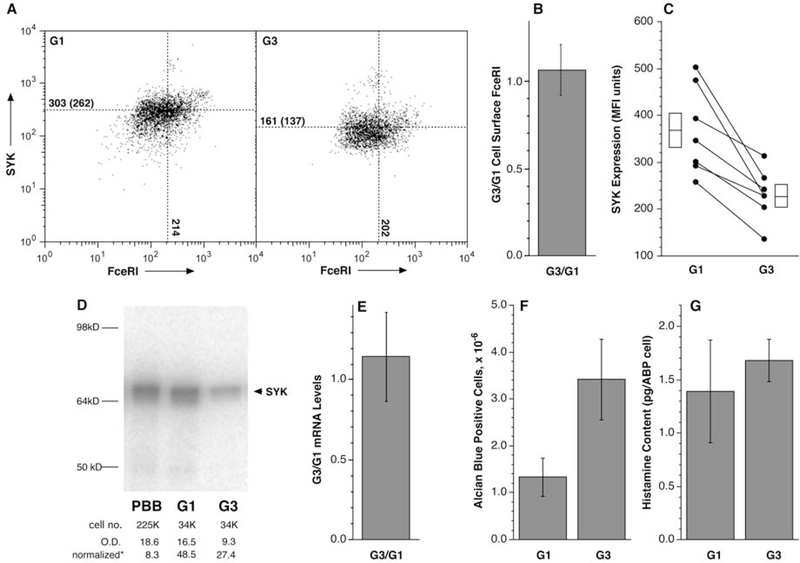
Figure 1:
Primary characteristics of G1 and G3 cultures. Using the methodologies described in the text and similar to Figure E4, G1 and G3 CD34B were generated and analyzed for various metrics of the basophil phenotype. Panel A: an example of SYK and FceRI expression for the G1 and G3 cultures as determined by flow cytometry (the gating for these plots was the exclusion of “debris” or dead cells using forward and side scatter followed by gating for CD123+ cells which represented ≈80% of the live cells). Panel B: relative FceRI expression for the G1 & G3 comparison. Panel C: compilation of SYK expression studies as assessed by flow cytometry. Panel D: example Western blots comparing CD34B G1 and G3 cell preparations compared to a PBB standard. The number of cells represented in the lysate run in the gel is noted as cell number (cell no.). Below this line is the optical density (O.D.) for the bands and the normalized OD per 100,000 cells. As found previously, SYK expression in the CD34B was significantly greater than PBB (≈6-fold in this instance). Panel E: rato of SYK mRNA expression for G1/G3 cells (see online repository Table E4 for details). Panel F: the total number of alcian-blue positive (ABP) cells. Panel G: histamine content per ABP cell counted.

