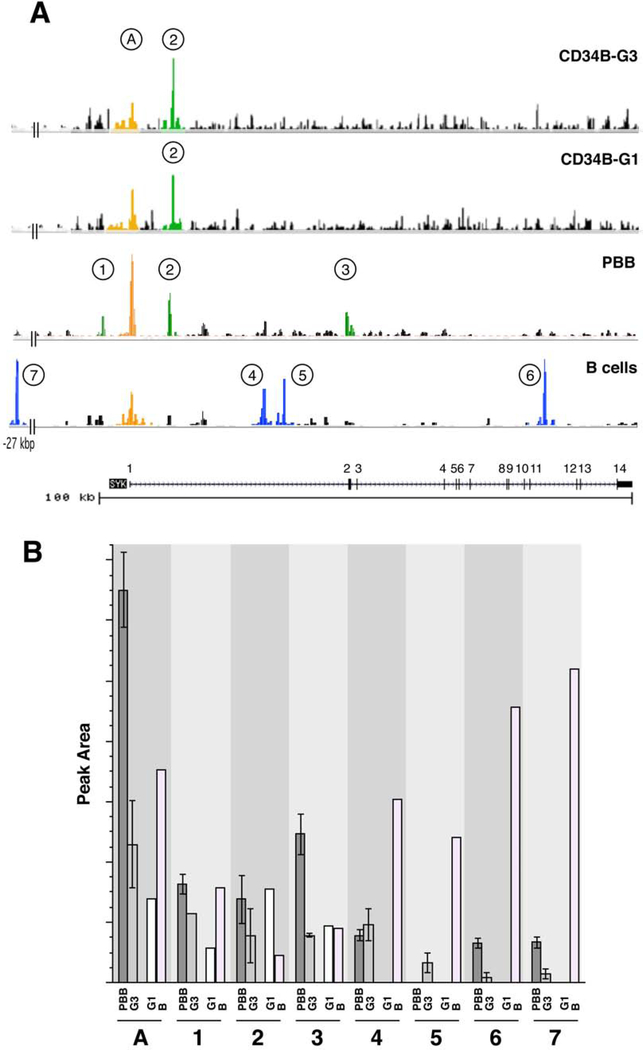
Figure 2:
ATACseq information for the SYK gene. Panel A: Four cell types, B cells, peripheral blood basophils (PBB), CD34B culture derived basophils using the G1 and G3 protocols, were analyzed by ATACseq and the data for the SYK gene (shown at the bottom of the figure, both exons (black regions) and introns (line with arrows indicating the direction of transcription), with numbered exons) collated using the UCSC browser. Eight peaks (identified by MACS2/HOMER annotation of the peak calls) are labeled: ‘A’ is the peak associated with the generally identified TSS for SYK and ‘1’ through ‘7’ peaks 5’ and throughout the gene. The bottom-most trace is the hypersensitivity profile identified in Genebank. Panel B: Summary of the ATAC results for the 8 identified peaks in the SYK gene. The ATACseq results were averaged for preparations that were of high quality; PBB (n=3), CB34B-G3 (n=2), CD34B-G1 (n=1), and B-cells (n=1). See online repository for methodological details.

