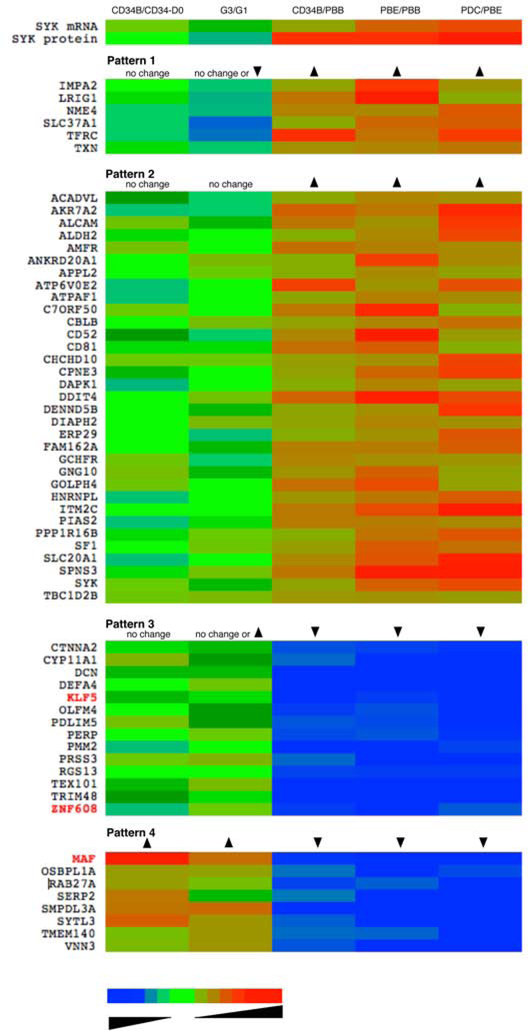
Figure 4:
Pattern matching SYK expression with transcript behavior across different cell types, displayed as a heat-map (see the online repository for a tabulated presentation of the same data, Table E3. Using microarray results for 5 types of cells [peripheral blood basophils (PBB), peripheral blood eosinophils (PBE), peripheral blood plasmacytoid dendritic cells (PDC), CD34-derived basophils (CD34B) developed with the G1 or G3 protocols] transcripts were analyzed for following 4 patterns of expression. The short gene name is shown to the left of the heat-map and columns in the heat-map are colored for the ratio of the presence of the transcripts for the comparison shown at the top of the column. The arrows in the patterns indicate whether the ratio for a particular comparison is greater than 1.0, less than 1.0 or relatively unchanged. The colors represent the log-fold-change of the transcript for the particular comparison, ranging from 0.01 to 100, blue to red with shaded green representing changes near 1.0-fold (where unchanged refers to ratios between 0.75- and 1.33-fold).

