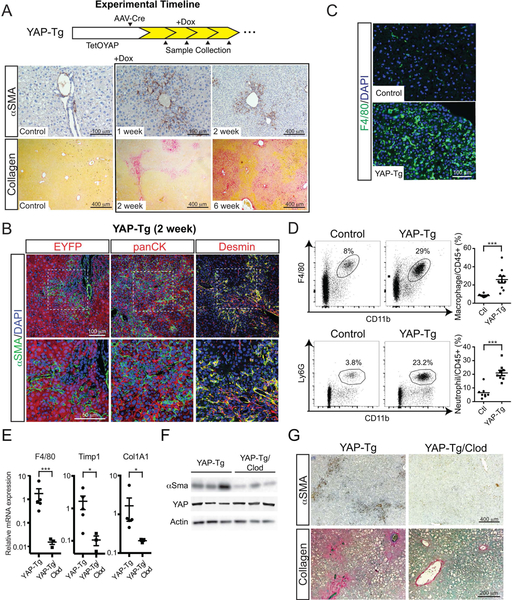
FIGURE 1. Hepatocyte-specific YAP expression activates αSMA+ myofibroblasts and recruits immune cells resulting in liver fibrosis.
A. Timeline of AAV-Cre delivery to adult TetOYAP mice, induction of YAP-Tg expression and subsequent sample collection. Representative α-smooth muscle actin (αSMA) and collagen staining from livers of TetOYAP mice at the indicated timepoints after doxycycline administration.
B. Confocal immunofluorescent liver staining of YAP-Tg mice after 2 weeks for the indicated proteins. Boxed area in upper picture is enlarged in the image below.
C. Immunofluorescent F4/80 liver staining of Control and YAP-Tg mice after 2 weeks.
D. Representative flow cytometry of liver neutrophils (CD45+CD11b+Ly6G+) and macrophages (CD45+CD11b+Ly6G−F4/80+) one week after YAP-Tg induction. Percentages are of the gated population. Right, dot plots of all flow cytometry experiments (n=8, control; n=9, YAP-Tg).
E. Dot plots of whole liver RT-qPCR of the noted genes after YAP-Tg or YAP-Tg mice treated with clodronate (YAP-Tg/Clod) two weeks after induction. Horizontal line represents the mean, each dot represents an experiment. Error bars indicate standard error. *p<0.05, **p<0.01, ***p<0.001.
F. Immunoblots of the indicated proteins in YAP-Tg or YAP-Tg/Clod two weeks after induction.
G. Representative αSMA and collagen stain of YAP-Tg and YAP-Tg/Clod two weeks after YAP-Tg induction.

