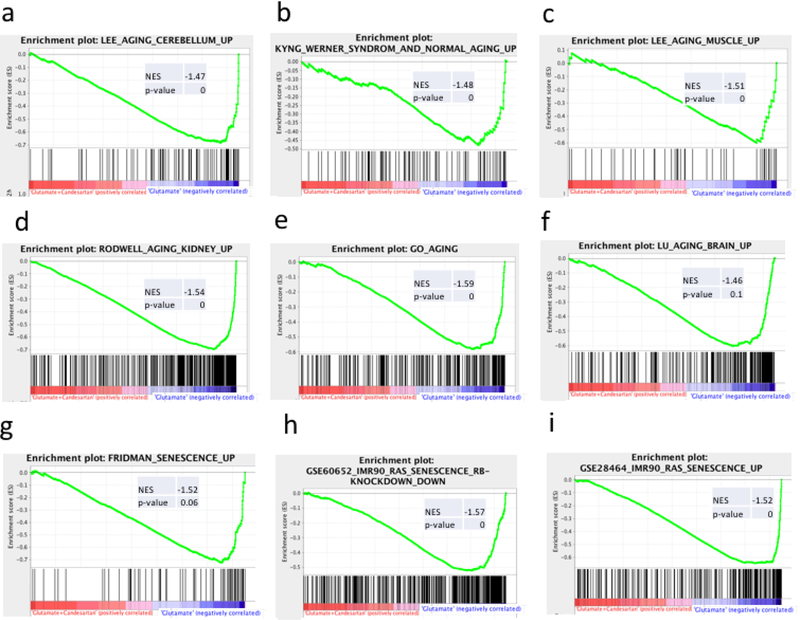
Fig 1. Gene Set Enrichment plots from representative aging pathway genesets.
The Fig represents Gene Set Enrichment Analysis plots showing the negative correlations of genes up-regulated by Glutamate and normalized by Candesartan in our neuronal cell culture with genesets associated with general aging in different brain areas and tissues (A-F, see Online Resource 1) and with senescence (G-I, see Online Resource 2). NES: Normalized Enrichment Score. Genesets with links and References are listed in this Table1.

