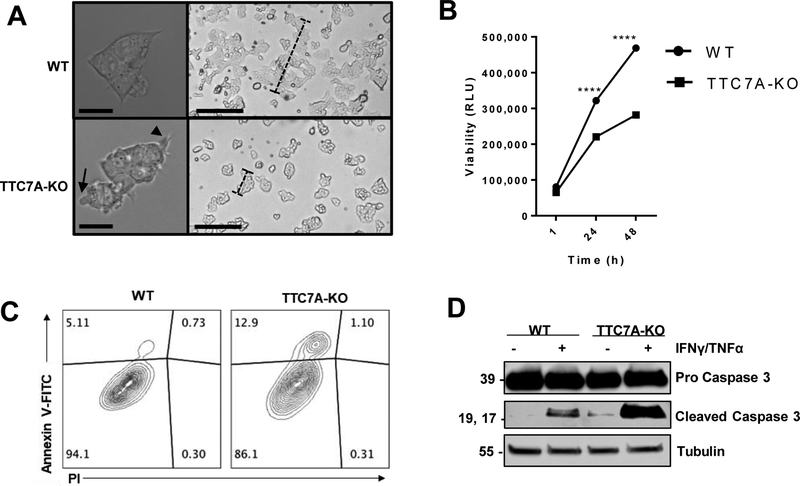
Figure 1. TTC7A-KO cells have an increased susceptibility for apoptosis.
(A) Morphology of WT and TTC7A-KO HAP1 cells, DIC microscopy. Left panels, objective magnification 63× (scale bar 10μm). Right panels, objective magnification 4× (scale bar 190μm). Blebs and filopodia-like processes are indicated by arrow and arrowhead, respectively. Dashed-bars highlight differences in colony sizes after 48 h of culturing. (B) Real-time viability assay. Two-way ANOVA with post hoc test (Sidak), ****p<0.0001, (n=3, 3 replicates). (C) Annexin V-FITC/PI flow cytometry demonstrated that TTC7A-KO have significantly increased Annexin-V staining. Data is quantified in Supplementary Figure 2B. (D) Western blot analysis of untreated and IFNγ (10 ng/ml)//TNFα-treated (30 ng/ml) WT and TTC7A-KO cells, 48 h (n=3). Refer to Supplementary Figure 2C for cleaved Caspase 3 (CC3) quantitation.

