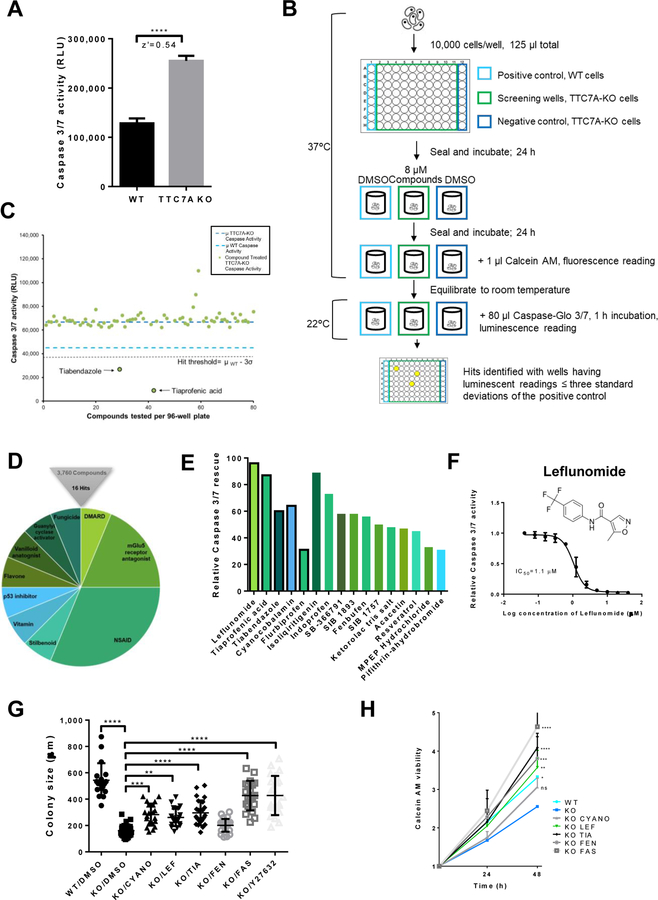
Figure 2. High-throughput drug screening identifies approved-compounds that improve the apoptotic phenotype.
(A) Modeling the high-throughput apoptosis-phenotype assay. Caspase-Glo® 3/7 assay, z’=0.54, data are presented as the mean ±SD. Unpaired t test, ****p<0.0001, (n=3, 8 replicates). (B) Drug screen workflow. See Methods. (C) A sample of plate-results from the Prestwick Chemical Library screen showing mean Caspase 3/7 activity from drug-treated wells (green dots) and DMSO-treated control wells, WT (light blue dashes) and TTC7A-KO cells (dark blue dashes). Tiabendazole and tiaprofenic acid reduced Caspase 3/7 activity below the hit threshold (μWT-3σ), z’= 0.56. (D) Drug screen summary, 0.4% hit rate. Hit compounds represent the 10 drug classification families shown. (E) Comparison of hit compound inhibition of apoptosis in TTC7A-KO cells. Black borders represent FDA-approved drugs and bar colors correspond to Figure 2D. (F) Concentration-response curve for leflunomide inhibition of Caspase 3/7 activity in HAP1 TTC7A-KO cells, IC50=1.1 μM, (n=3). (G) Colony size formation in WT, TTC7A-KO, and drug-treated TTC7A-KO cells. Drug abbreviations: cyanocobalamin (CYANO), leflunomide (LEF), tiaprofenic acid (TIA), fenbufen (FEN), and fasudil (FAS). Plotted values represent individual cell colonies, error bars presented as mean ±SD. Statistical significance was relative to the KO/DMSO control. One-way ANOVA with post hoc test (Dunnett), ****p<0.0001, ***p<0.001, **p<0.01, (n=3, 6 replicates per condition). (H) Viability assay. Statistical significance relative to KO/DMSO (blue). WT (*p<0.05), KO/LEF (**p<0.01), KO/TIA (****p<0.0001), KO/FEN (***p<0.001), KO/FAS (****p<0.0001), two-way ANOVA with post hoc test (Dunnett), (n=3, 4 replicates per condition).

