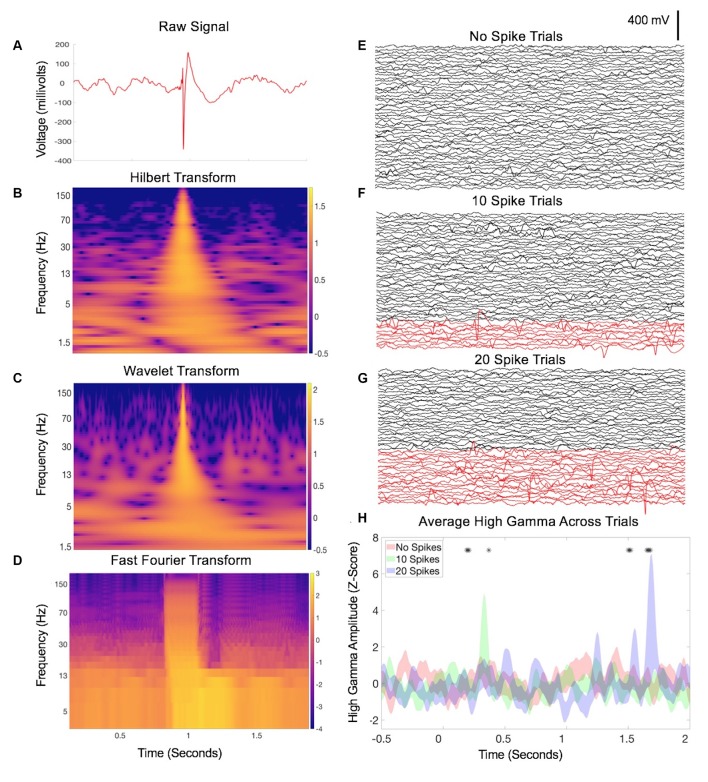
Figure 1.
Interictal epileptiform discharges (IED)-related data contamination. (A) Example of an IED from a single channel during a 2-s intracranial electroencephalography (IEEG) recording. Classic features are apparent including a sharp, large-amplitude displacement of voltage and an after going slow-wave, otherwise with a relatively normal baseline mix of frequencies before and afterward. (B) Hilbert transform spectrogram of the data in (A). Note the transient but substantial increase in power across nearly all frequencies, due to the sharp component of the waveform, and a subtle sustained increase in low-frequency power related to the after going slow-wave. (C) Wavelet transform spectrogram of the data in (A), with similar findings as in (B). (D) Fourier transform of A (Mitra and Bokil, 2007; Chronux Home, 2019) with 0.25-s overlapping windows, sliding point-by-point to provide similar time resolution as (B,C). Similar findings as in (B,C), with an additional duration of the power increase in the faster frequencies due to the nature of the consistent time window across frequencies for the FFT calculation. Panels (E–G) each display IEEG data from 50 trials, recorded from a single channel during a speech listening task (one pre-recorded sentence played aloud for each trial starting at time zero). In panel (F), 10 trials were swapped with trials that contained IEDs, shown in red. A hybrid of manual and automated approaches (Baud et al., 2018) was used. Panel (G) increases this to 20 trials with IEDs. Panel (H) shows the average high gamma across trials in each group (Hilbert transform, 50–200 Hz) from one electrode contacting the inferior temporal gyrus that was not truly modulated by the sentence-listening task. Asterisks denote time points during which one of the latter groups deviates significantly from baseline (two-way repeated-measures ANOVA, p < 0.05). As the proportion of trials with IEDs increases, additional falsely positive timepoints emerge.

