Figure 7.

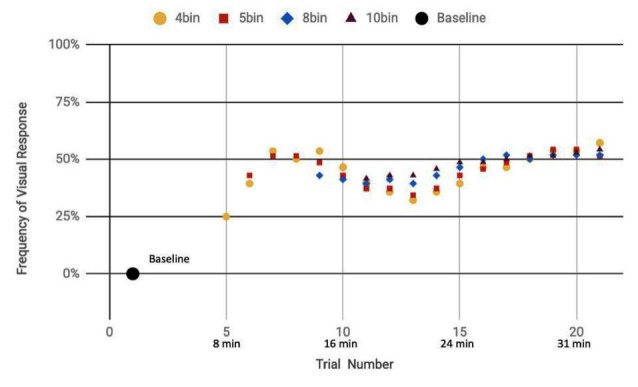
Reported visual response rate of participants exposed to a random mix of actual and sham DU vs. trial number and the corresponding time.

Reported visual response rate of participants exposed to a random mix of actual and sham DU vs. trial number and the corresponding time.