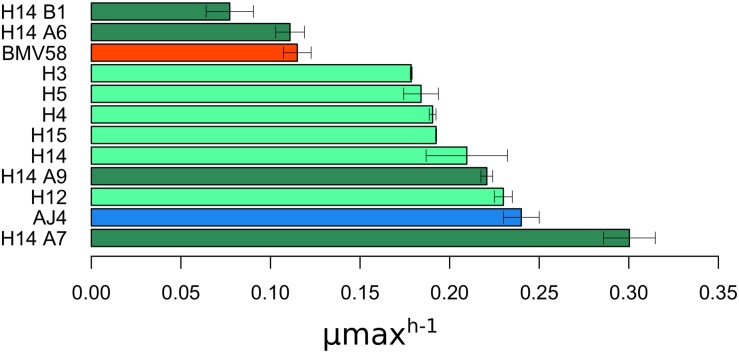
FIGURE 1.
Maximum growth rate (μ max) of the different colonies after stabilization by vegetative growth and sporulation. μ max data is represented as the mean value of three replicates with its standard deviation. The data was retrieved after growing the colonies in SM with 30 g/L of sugars and 6.5%(v/v) of exogenous ethanol. Colonies stabilized by vegetative growth are filled in light green color, and those stabilized by sporulation in dark green; Parental AJ4 is shown in blue, and BMV58 in red.

