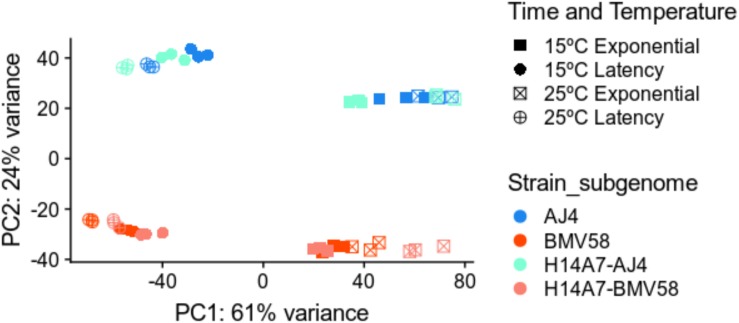
FIGURE 4.
Principal component analysis of the transcriptome variation in S. uvarum BMV58, S. cerevisiae AJ4, and the S. uvarum and S. cerevisiae subgenomes of the artificial hybrid under two different temperatures and fermentation phases. All sequenced transcriptomic samples were plotted in this PCA. The PCA plot shows the greater variation in the fermentation phase and in the species gene expression. Triplicates are shown in the same color and shape, as follows: blue, AJ4; red, BMV58; orange, H14A7-uvarum; turquoise, H14A7-cerevisiae; squares, exponential phase; circles, latency phase; filled, 15°C; a cross, 25°C.

