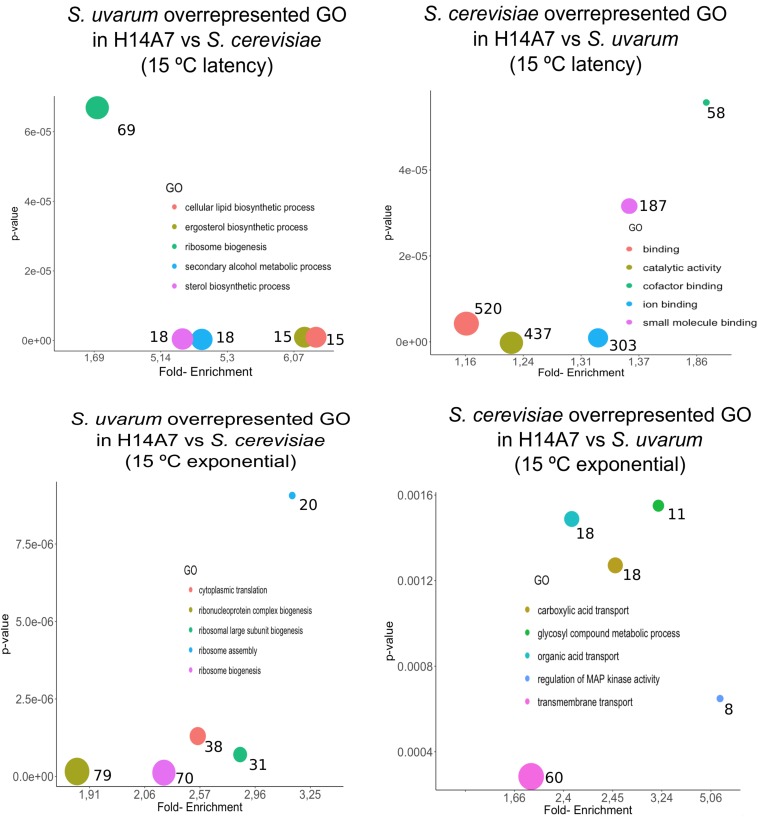
FIGURE 7.
Top 5 significant GO terms retrieved from the differentially expressed genes amongst S. cerevisiae and S. uvarum subgenomes in the H14A7 monosporic derivative at 15°C. For each one of the 4 graphs (S. uvarum latency overrepresented, S. cerevisiae latency overrepresented, S. uvarum exponential overrepresented and S. cerevisiae exponential overrepresented) the x-axis represents de fold-enrichment and the y-axis the p-value, retrieved from Panther Gene List Analysis. The sizes of the circles represent the number of terms that are included in each GO.

