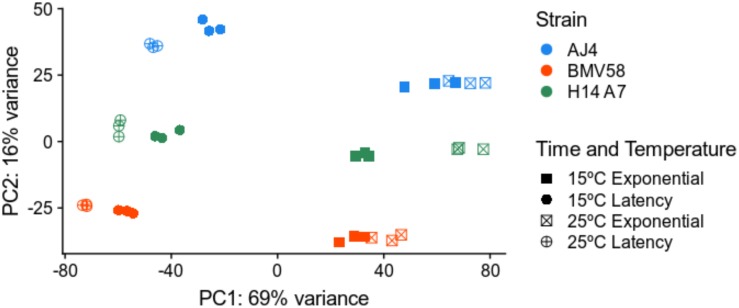
FIGURE 8.
Principal Component Analysis of the transcriptome variation in S. uvarum BMV58, S. cerevisiae AJ4, and the monosporic derivative H14A7 genome (S. uvarum + S. cerevisiae subgenomes) under two different temperatures and fermentation phases. All sequenced transcriptomic samples were plotted in this PCA (3 strains × 2 phases × 2 temperatures × triplicates). The PCA plot shows the greater variation in expression levels in the fermentation phase and in the species-specific gene expression. Triplicates are shown in the same color and shape, as follows: blue, AJ4; red, BMV58; green, H14A7; squares, exponential phase; circles, latency phase; filled, 15°C; a cross, 25°C.

