Figure 1.
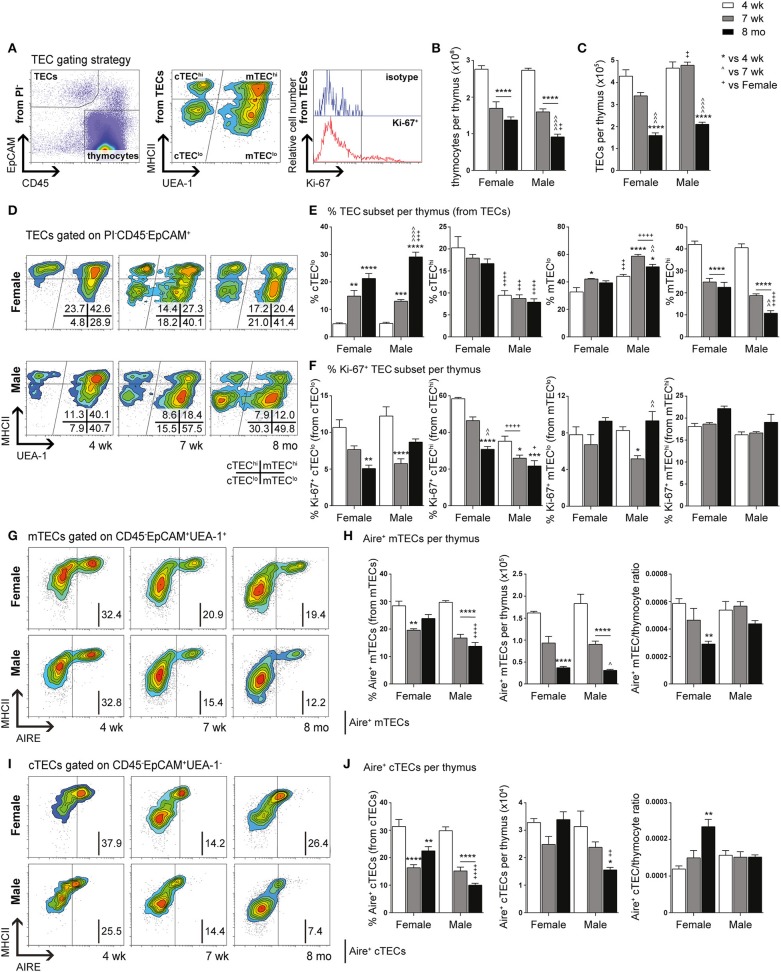
Phenotypic analysis of TEC subsets in female and male mice during aging. (A) Gating strategy identifying thymocytes and TECs in 4-week-, 7-week-, and 8-month-old female and male C57BL/6J mice. UEA-1 and MHCII were used to further segregate TECs into cTEClo, cTEChi, mTEClo, and mTEChi subpopulations. Proliferative cells were identified based on fluorescence exceeding Ki-67 isotype levels. (B) Total thymocyte cellularity. (C) Total TEC cellularity. (D) Representative contour plots depicting proportional changes in TEC subsets in relation to gender with aging. (E) Proportion of cTEClo, cTEChi, mTEClo, and mTEChi subpopulations. (F) Proportion of Ki-67+ cells within TEC subsets. (G) Representative contour plots depicting proportional changes in Aire+ mTEC subpopulations in relation to gender with aging. (H) Proportion and number of Aire+ mTECs per thymus, and Aire+ mTEC/thymocyte ratio. (I) Representative contour plots depicting proportional changes in Aire+ cTEC subpopulations in relation to gender with aging. (J) Proportion and number of Aire+ cTECs per thymus, and Aire+ cTEC/thymocyte ratio. Data presented as mean + SEM (n ≥ 3). * vs. 4 wk, ∧ vs. 7 wk, + vs. Female (age matched). *p < 0.05, **p < 0.01, ***p < 0.001, ****p < 0.0001, ordinary two-way ANOVA with Tukey's multiple comparisons.

