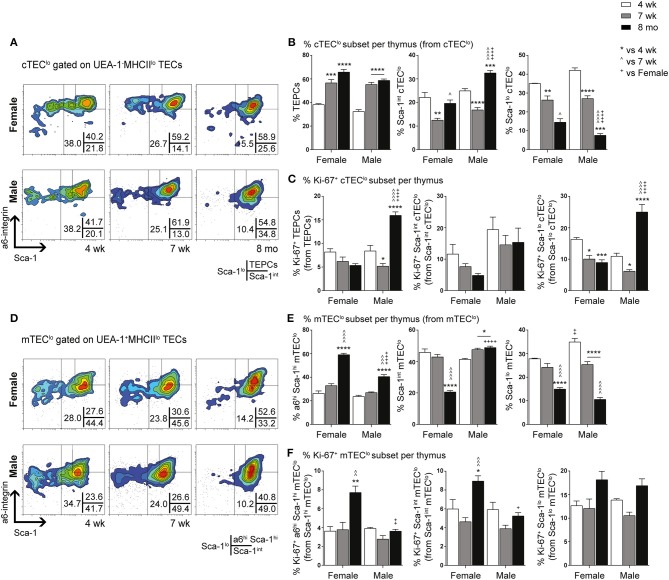
Figure 2.
Phenotypic analysis of TEPC and mTEC progenitor subsets in female and male mice during aging. (A) Representative contour plots depicting proportional changes in cTEClo subsets in relation to gender with aging. Antibodies against α6-integrin and Sca-1 were used to segregate cTEClo into TEPC (α6hi Sca-1hi), Sca-1int cTEClo, and Sca-1lo cTEClo subpopulations. (B) Proportion of TEPC, Sca-1int cTEClo, and Sca-1lo cTEClo. (C) Proportion of Ki-67+ cells within cTEClo subsets. (D) Representative contour plots depicting proportional changes in mTEClo subsets in relation to gender with aging. Antibodies against α6-integrin and Sca-1 were used to segregate mTEClo into α6hi Sca-1hi mTEClo, Sca-1int mTEClo, and Sca-1lo mTEClo subpopulations. (E) Proportion of α6hi Sca-1hi mTEClo, Sca-1int mTEClo, and Sca-1lo mTEClo. (F) Proportion of Ki-67+ cells within mTEClo subsets. Data presented as mean + SEM (n ≥ 3). * vs. 4 wk, ∧ vs. 7 wk, + vs. Female (age matched). *p < 0.05, **p < 0.01, ***p < 0.001, ****p < 0.0001, ordinary two-way ANOVA with Tukey's multiple comparisons.

