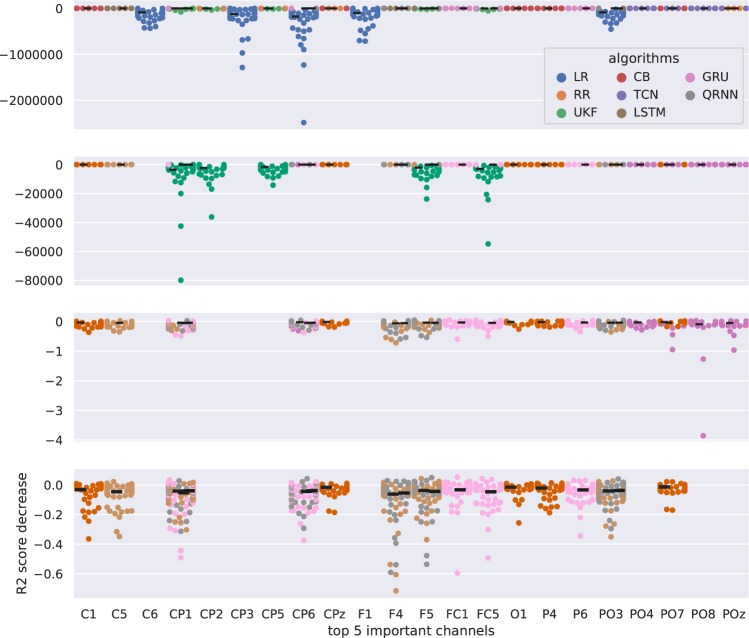
Figure 11.
Feature of importance in channel assessment for each decoding algorithm evaluated with R2 score. There are four plots that share the same x-axis with the channel of importance after input perturbation analysis. The y-axis shows the decrease in the R2 score after the perturbation of the channel. The first plot includes all the decoding algorithms. The second plot shows algorithms without LR and RR. The third plot shows the algorithms without LR, RR, and UKF. The fourth plot shows algorithms without LR, RR, UKF, and TCN. The thick black line represents the median decrease in R2 score for each algorithm for each channel.

