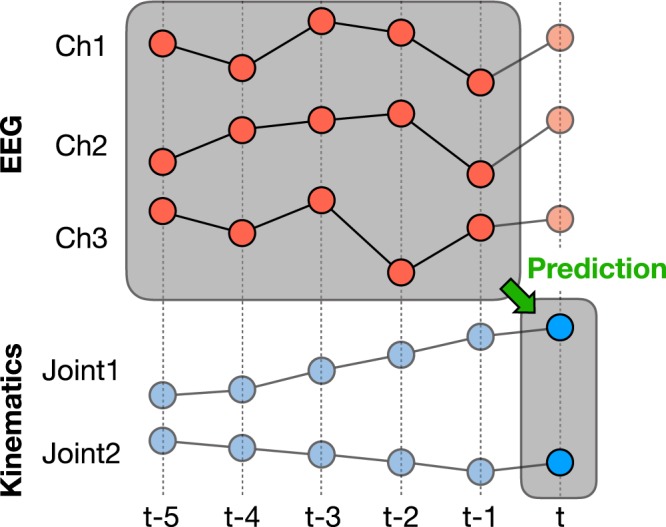
Figure 2.

Example decoding schematic for tap size = 5. When running multiple experiments, the tap sizes ranged from 1, 2, 5, 10, 20, 30, 40, 50. Given the sampling frequency of 100 Hz, this corresponds to 10, 20, 50, 100, 200, 300, 400, 500ms, respectively.
