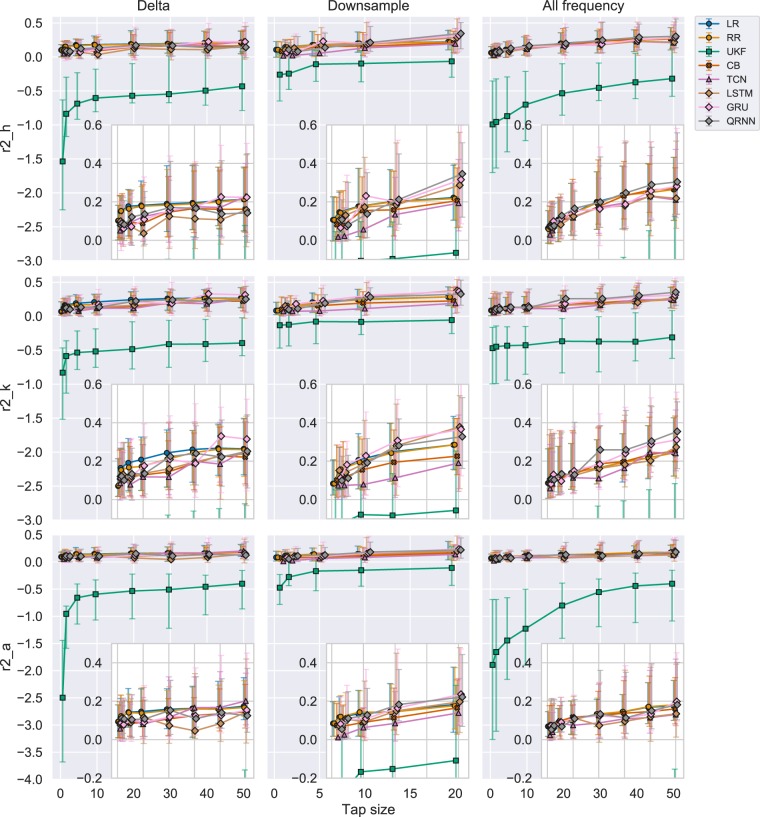
Figure 5.
R2 scores for each experiment across all the joints including UKF. Each row represents each joint angle for the right leg and each column represents each experiment. Each point is a median of R2 score across trials and subjects. Each errorbar represents 25th to 75th percentile. The inset figures are the magnified version to compare algorithms other than the UKF. Different decoding algorithms are differentiated using colors. Similar algorithms were grouped using shapes. Linear algorithms with a circle (LR: Linear Regression, RR: Ridge Regression), Adaptive filter with a square (UKF: Unscented Kalman Filter), Boosting with a cross (CB: CatBoost), CNN with a triangle (TCN: Temporal Convolutional Network), RNN with a diamond (LSTM: Long Short Term Memory, GRU: Gated Recurrent Unit, QRNN: Quasi-Recurrent Neural Network).

